Stakeholder knowledge
Capture planning priorities, local knowledge, concerns and alternative visions from policymakers, practitioners and communities.
Urban planning for a climate-neutral future
An AI-supported urban decision platform for exploring pathways to carbon neutrality.
Cities need to make connected choices about growth, mobility, buildings, land, nature and human behaviour. The Explorer brings these choices into a shared planning pathway, helping decision-makers examine how alternative urban futures could affect emissions, carbon sequestration and wider planning outcomes.
From shared priorities to spatial scenarios and measurable outcomes
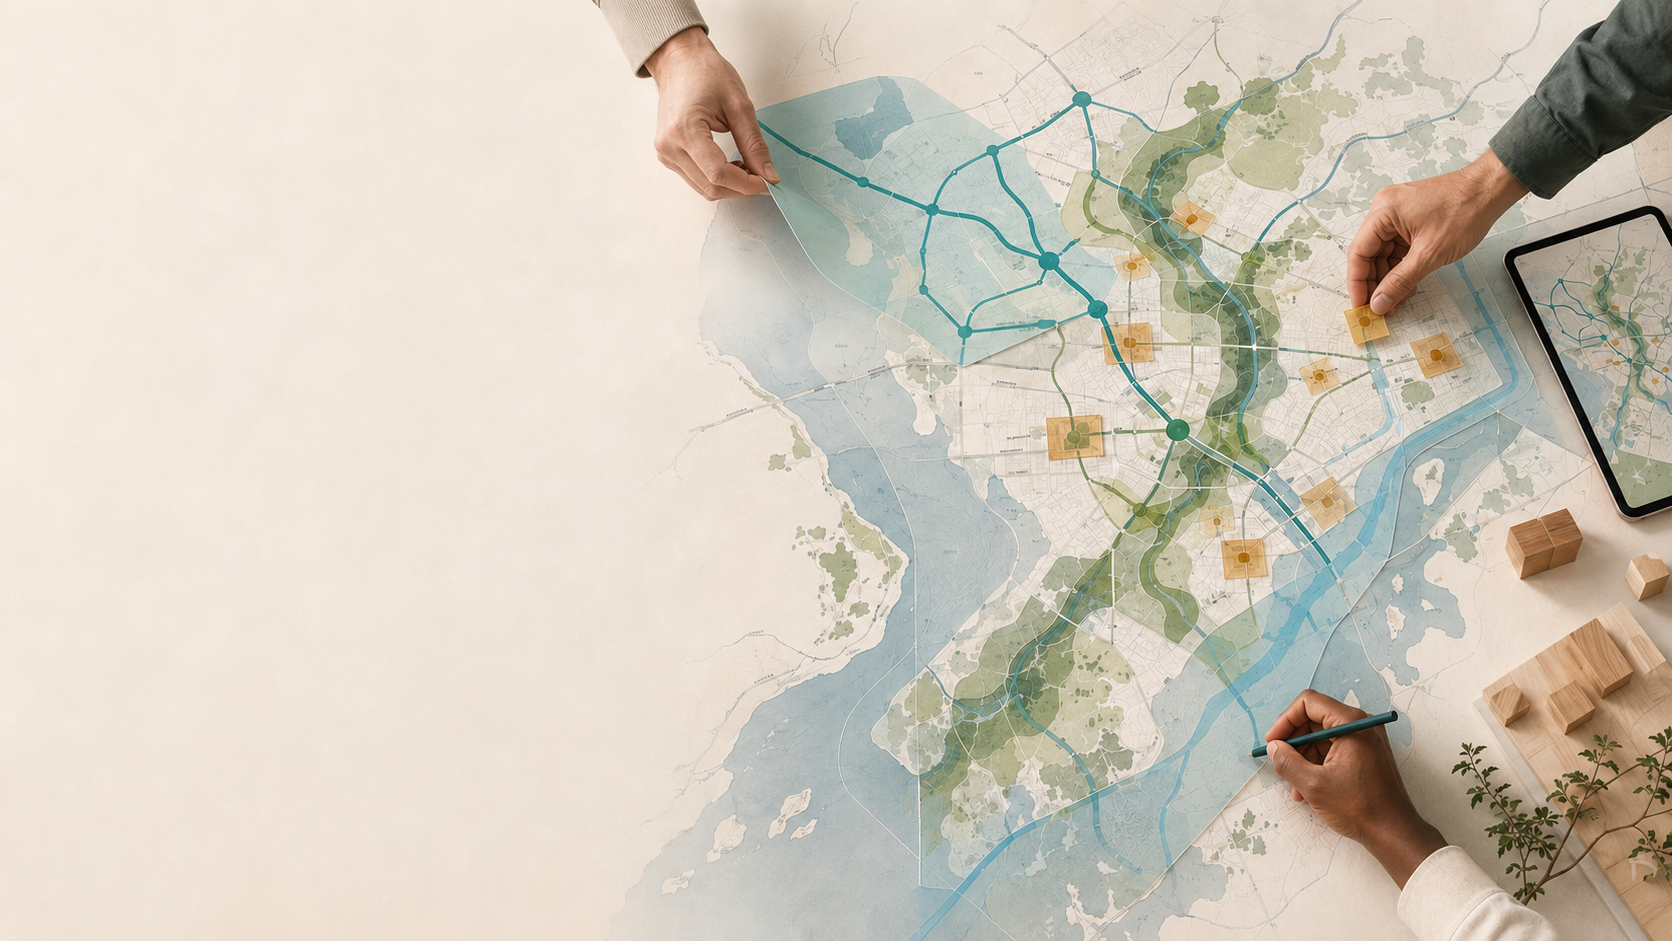
Illustrative future-city visual: project team
The planning challenge
Urban climate actions interact. New development changes travel demand. Transport investment influences where people and businesses locate. Zoning affects growth patterns. Green infrastructure stores carbon, manages water and changes access to nature.
Policies and behavioural responses shape whether interventions achieve their intended effects. Decisions made separately can miss these connections. A shared planning environment allows cities to examine them together.

A shared evidence base
Capture planning priorities, local knowledge, concerns and alternative visions from policymakers, practitioners and communities.
Use available land, infrastructure, environmental and socioeconomic data to establish the planning context across different cities.
Explore where future development, conservation and restoration could occur under different planning assumptions.
Examine implications across buildings, transportation, green infrastructure, zoning and policy, and behavioural responses.
Compare spatial patterns, carbon outcomes and planning trade-offs in a form that supports discussion and revision.

Social and spatial context
Residential mobility patterns reveal how urban change affects different groups. Bringing this evidence into the same planning conversation helps make distributional effects visible.
The purpose is to make alternative futures visible, comparable and open to discussion.
Planning pathway
The Explorer organizes planning as an iterative process. Planners and stakeholders define the problem, translate priorities into assumptions, simulate change, assemble interventions, compare outcomes and revise the pathway.
Clarify the target year, geographic scope, climate objective and decisions under consideration. Bring planners, policymakers and other stakeholders into a shared problem frame.
What needs to change, where, by when—and for whom?Turn stakeholder visions and policy language into explicit scenario assumptions. AI can help organize qualitative input and connect planning narratives with spatial parameters.
Stakeholder priority → scenario assumptionCombine existing conditions, development demand, accessibility, planning restrictions, historic land cover and stakeholder-defined assumptions.
Reference landscape → possible patterns of changeExplore measures across connected systems, from compact development and building renewal to transport, nature-based solutions, spatial policy and behaviour.
Illustrative functionalityCompare alternative futures using a consistent set of spatial, carbon, accessibility and planning indicators.
One evidence structure across every scenarioReview results with stakeholders, identify trade-offs, adjust assumptions and test a revised combination of measures as evidence and priorities change.
Comparison becomes the next decisionIllustrative workshop visual: project team
Envision and Intervene connect policy narratives and stakeholder input with structured measures and model inputs.
Establish a reference landscape, then examine where development, conservation or restoration could occur.
Explore historic land cover ↗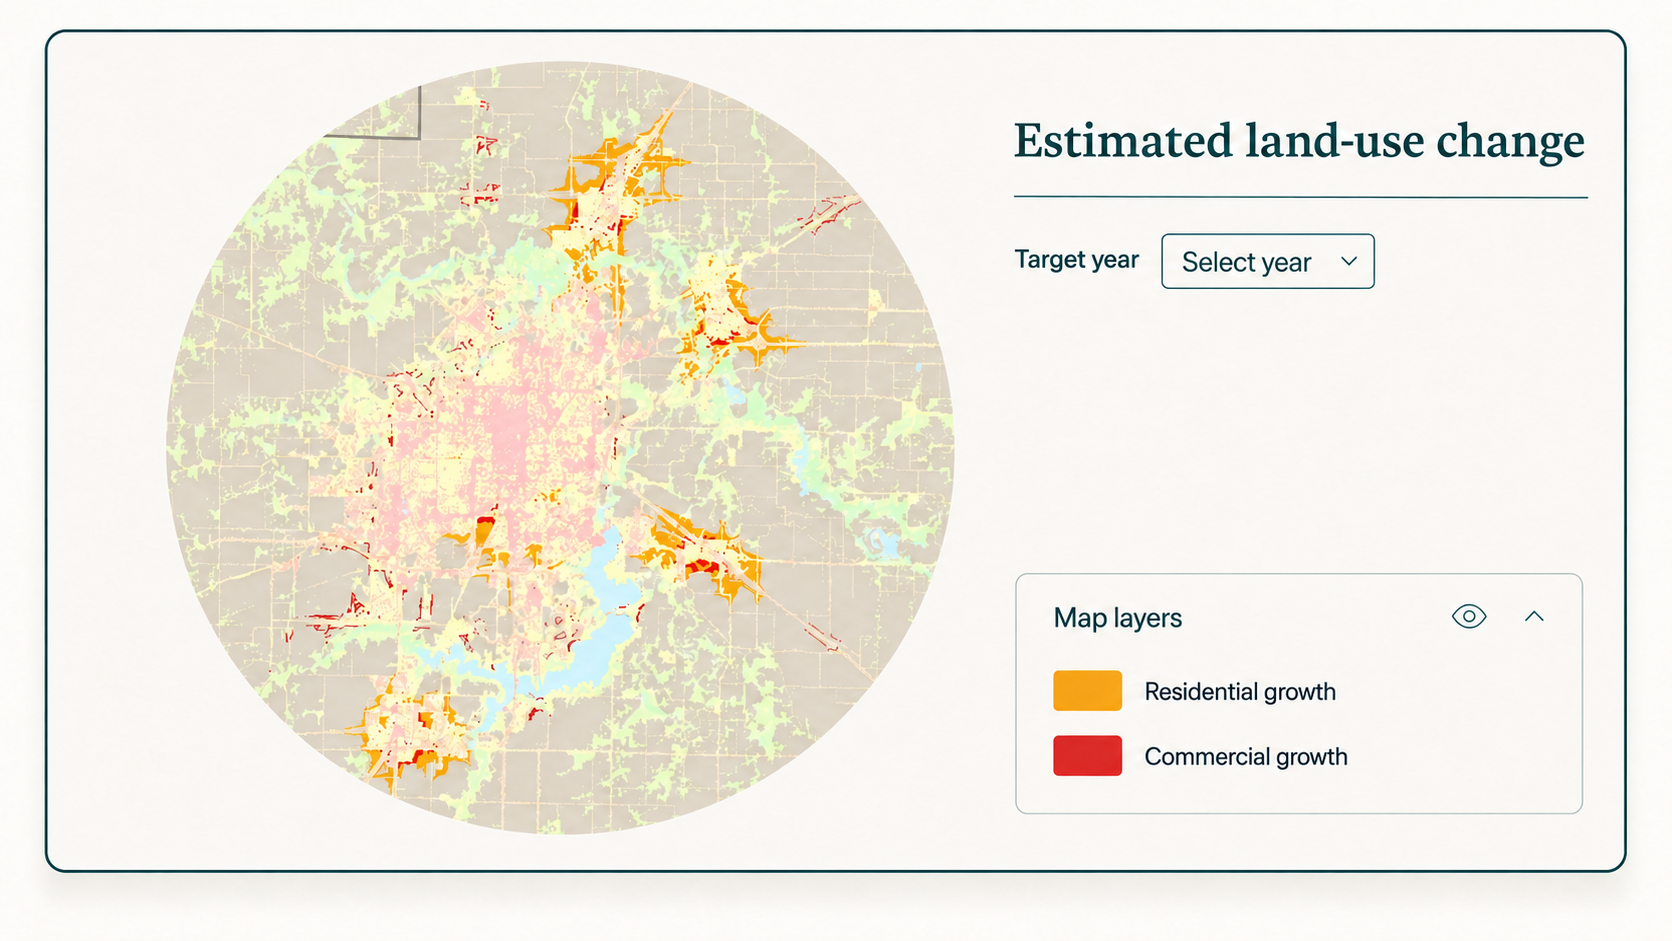
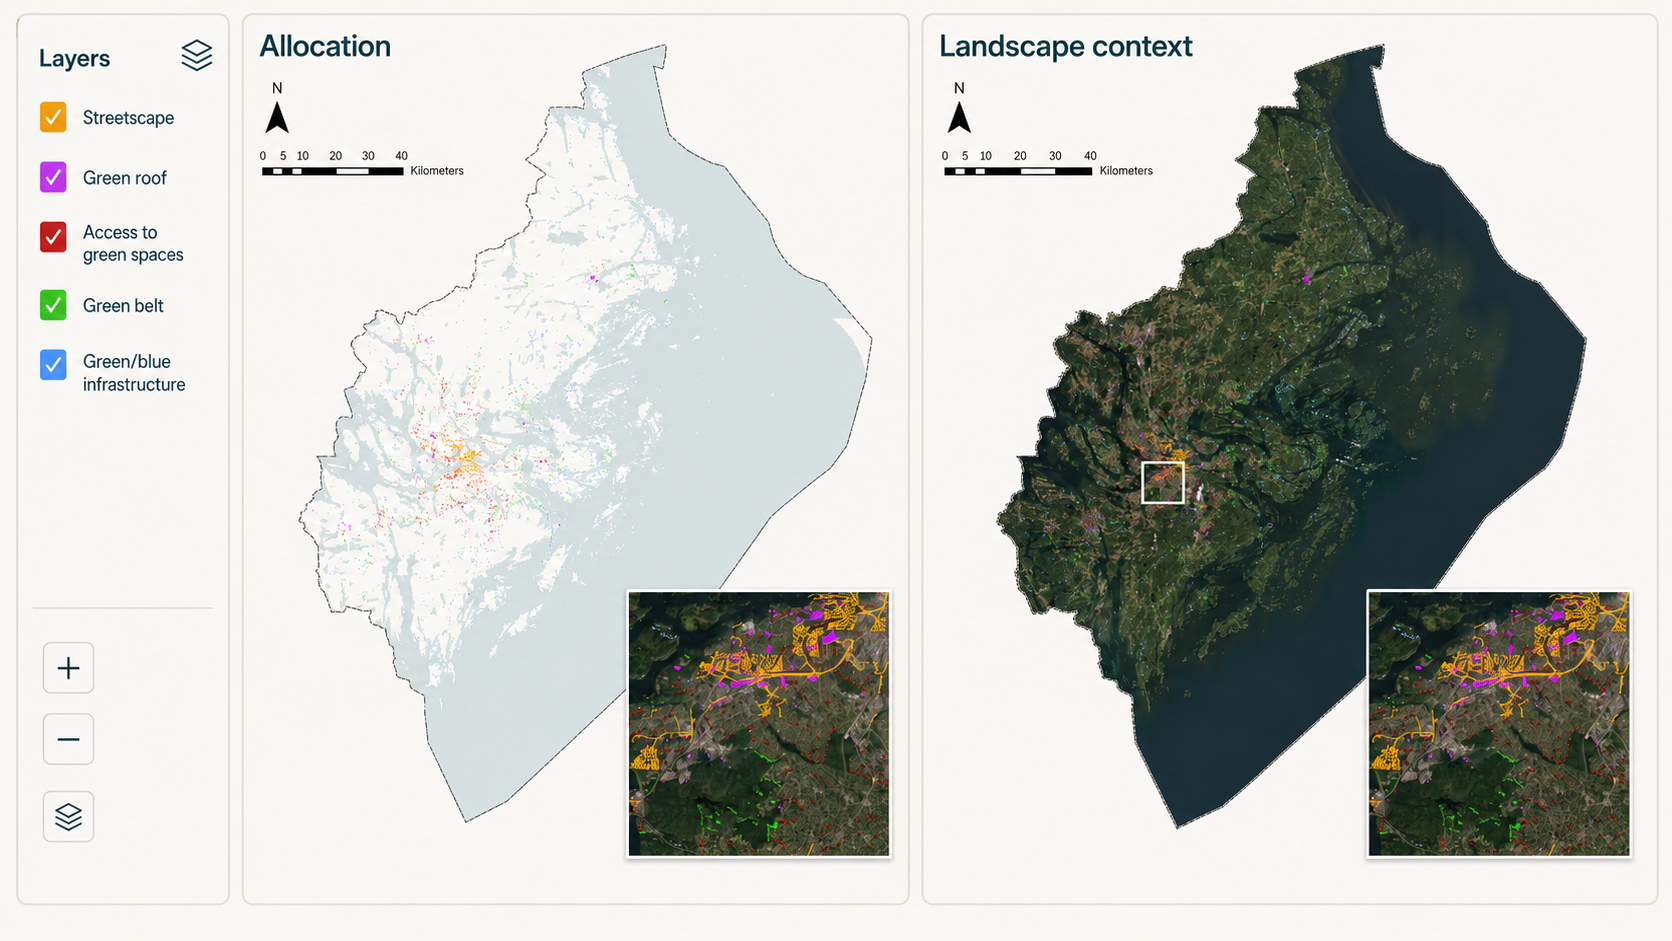
Compare multiple nature-based solutions without separating them from the wider urban pathway.
Planning is iterative: each comparison creates a clearer basis for the next decision.
Connected urban systems
Carbon-neutral planning requires more than a single model or intervention. The Explorer connects several systems around a shared spatial scenario so planners can see reinforcement and trade-offs.
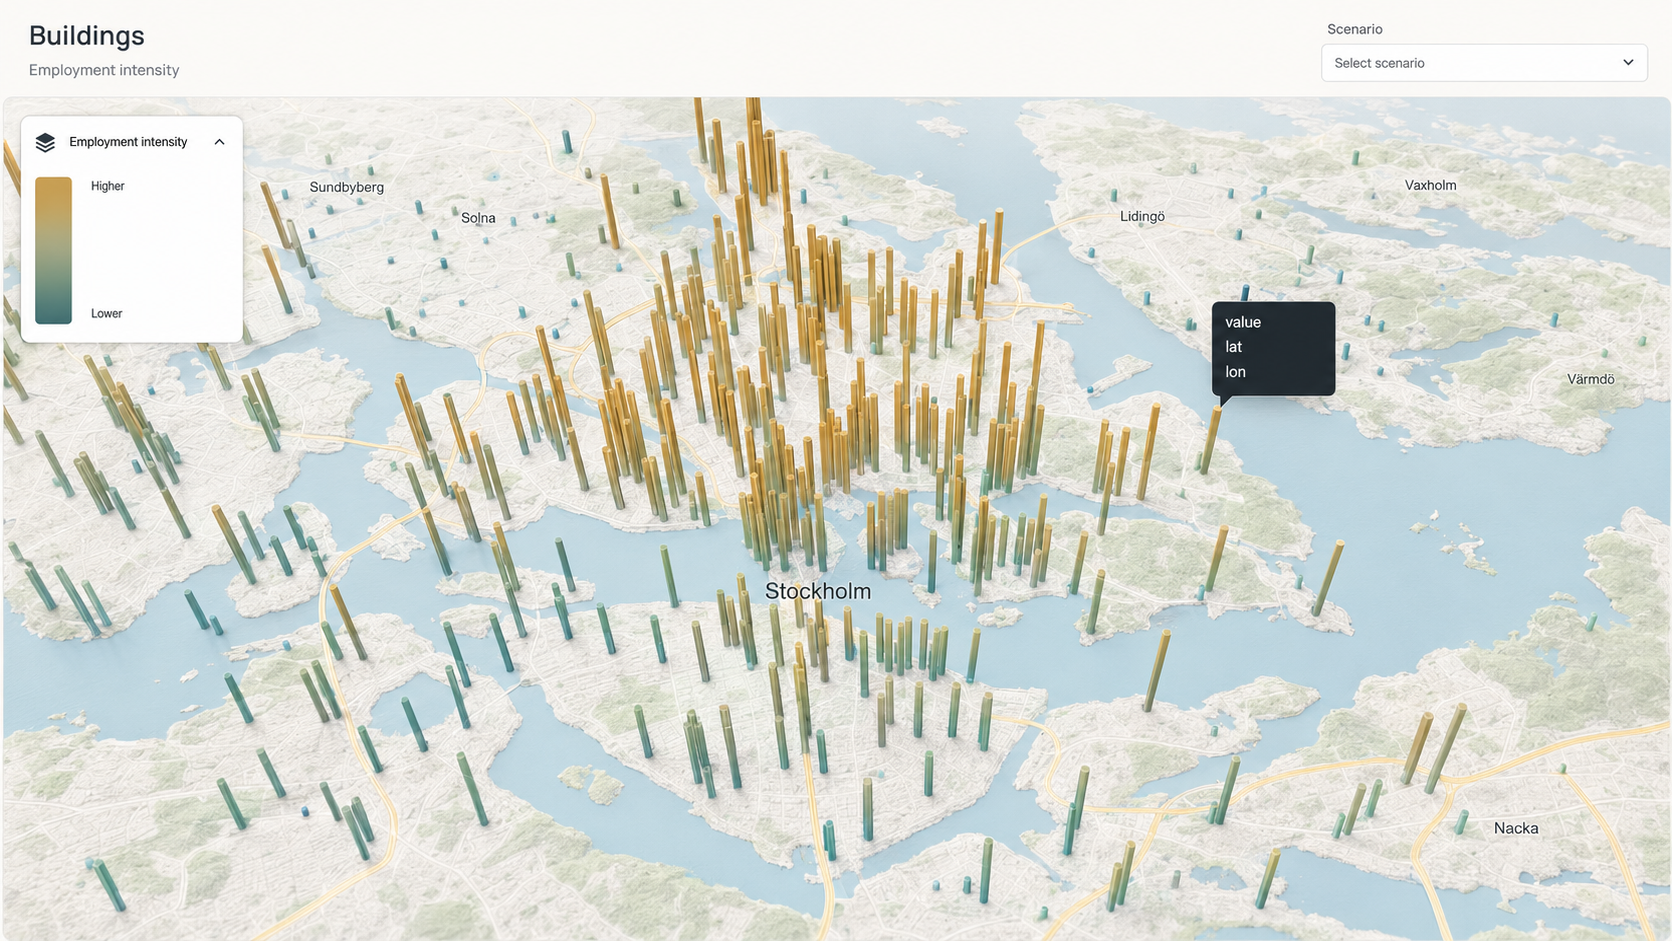
Explore the spatial distribution of buildings, jobs and activities. Define renewal areas and compare future development forms and densities.
Examine how development location, accessibility and last-mile choices affect transportation outcomes, including improved connections, mode shifts and compact growth.
Explore the Last-Mile tool ↗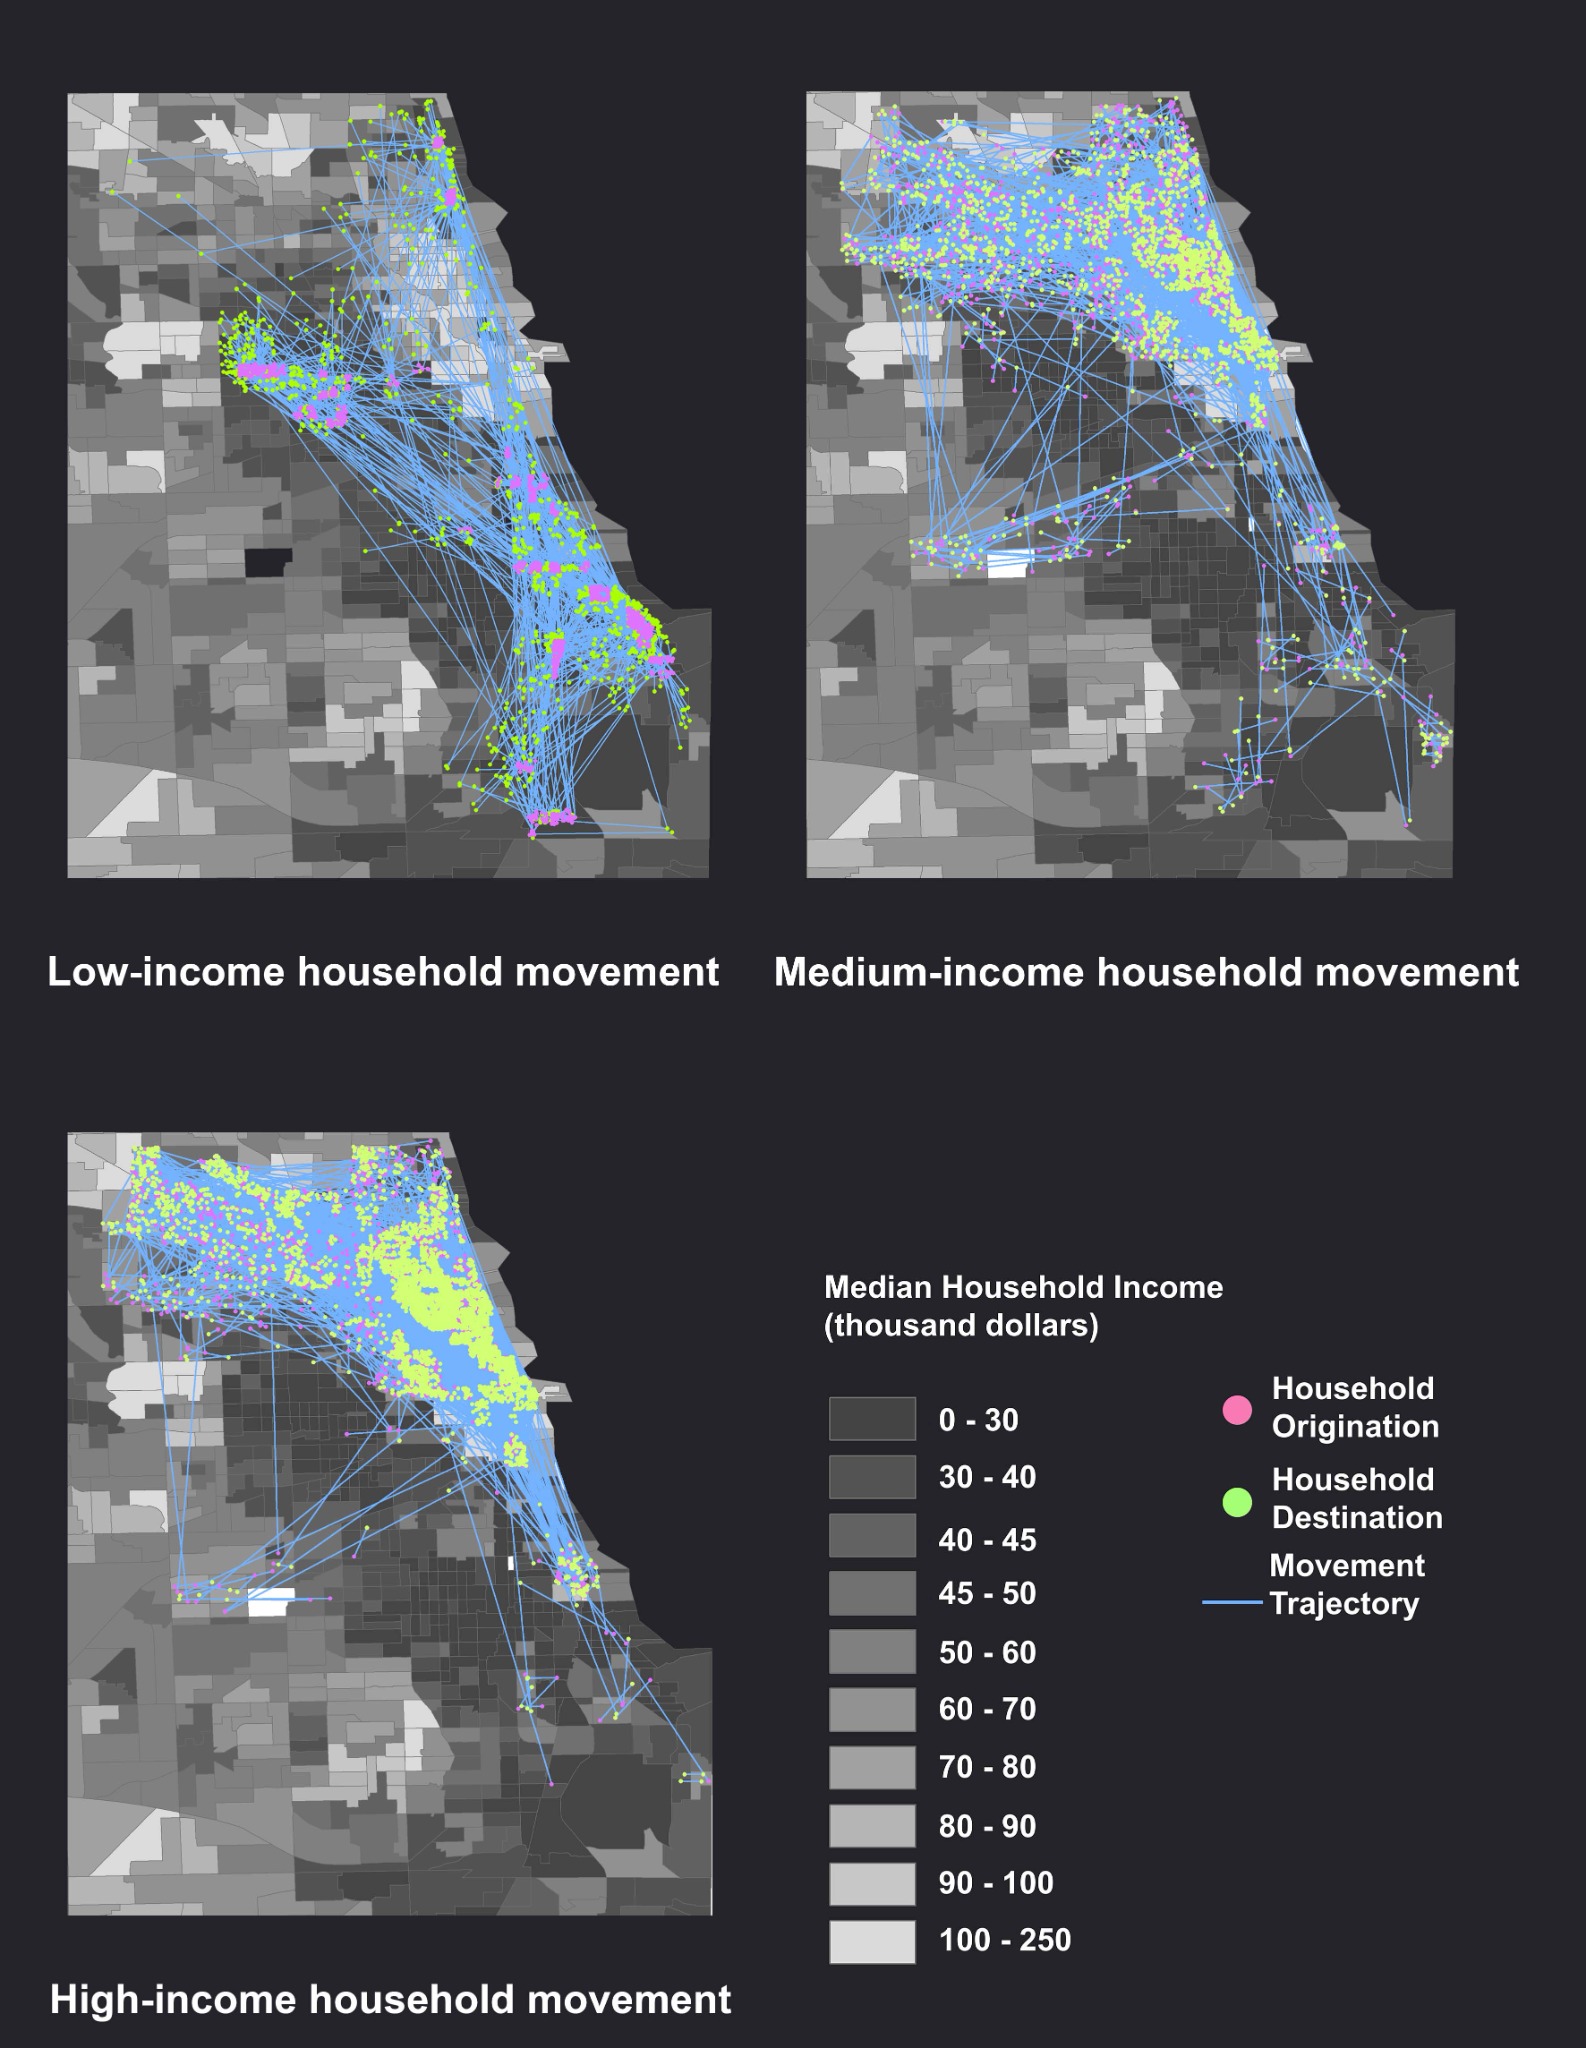
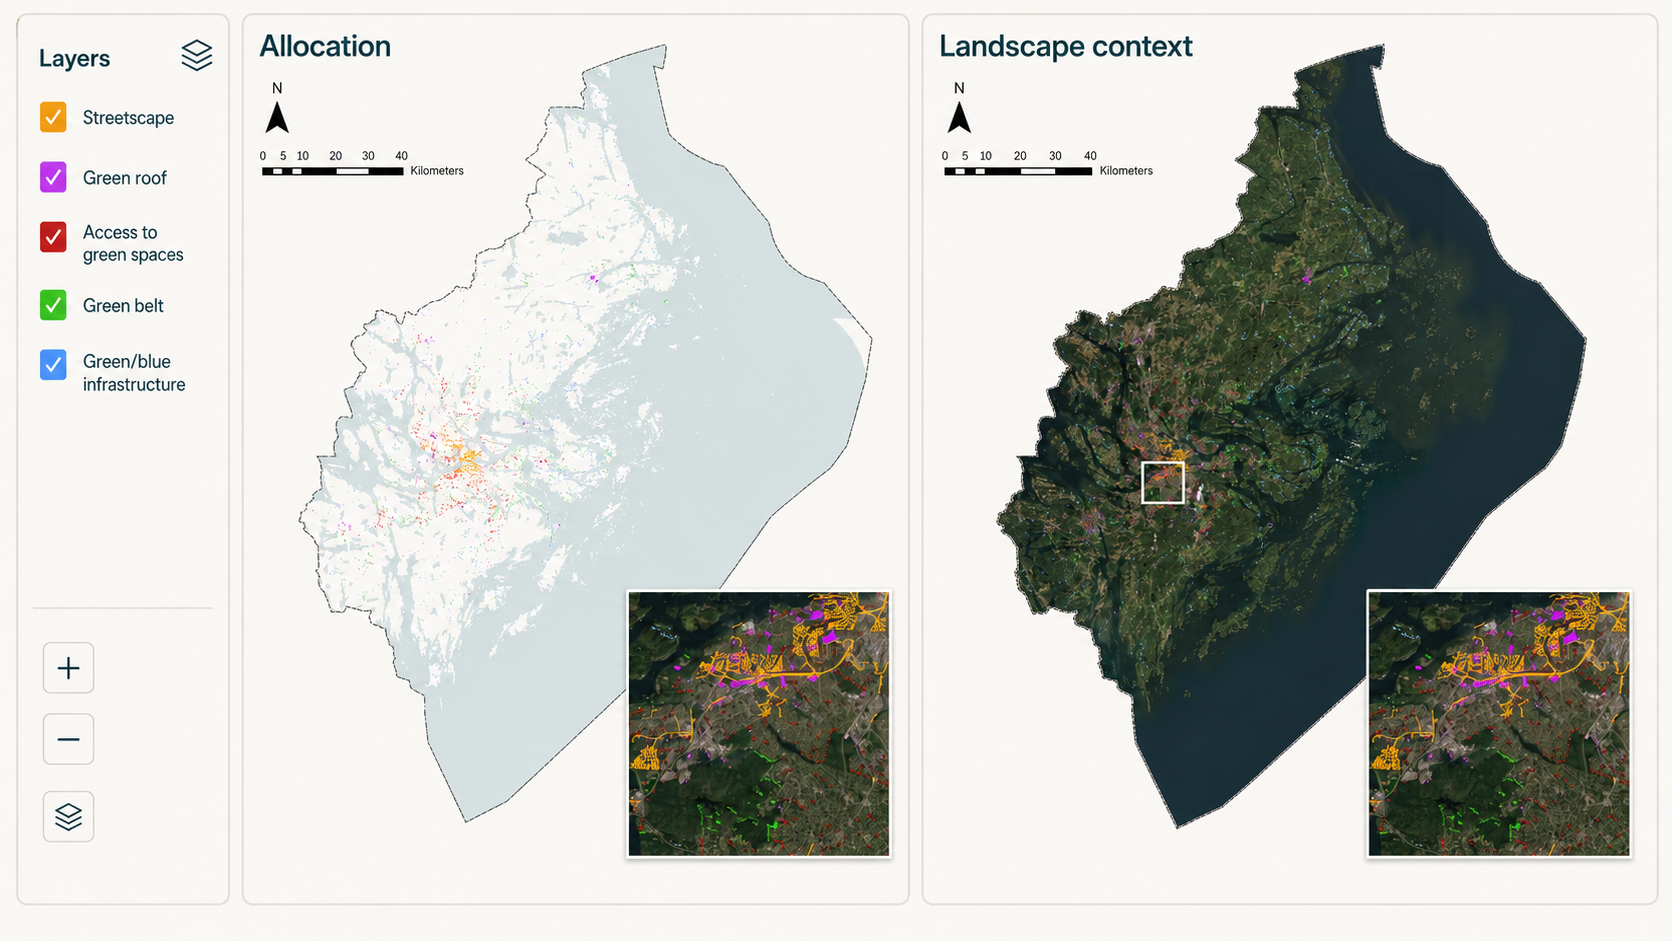
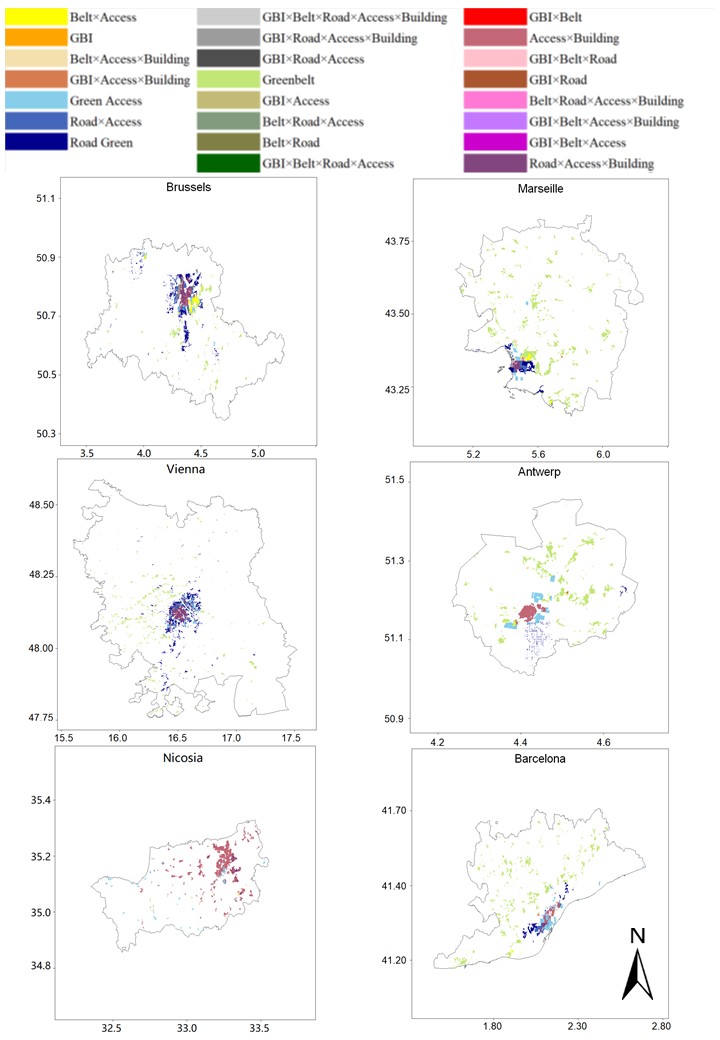
Explore green roofs, corridors, streetscape vegetation and access improvements while considering carbon, biodiversity, heat, water and access to nature together.
Open the Nature-Based Solutions Dashboard ↗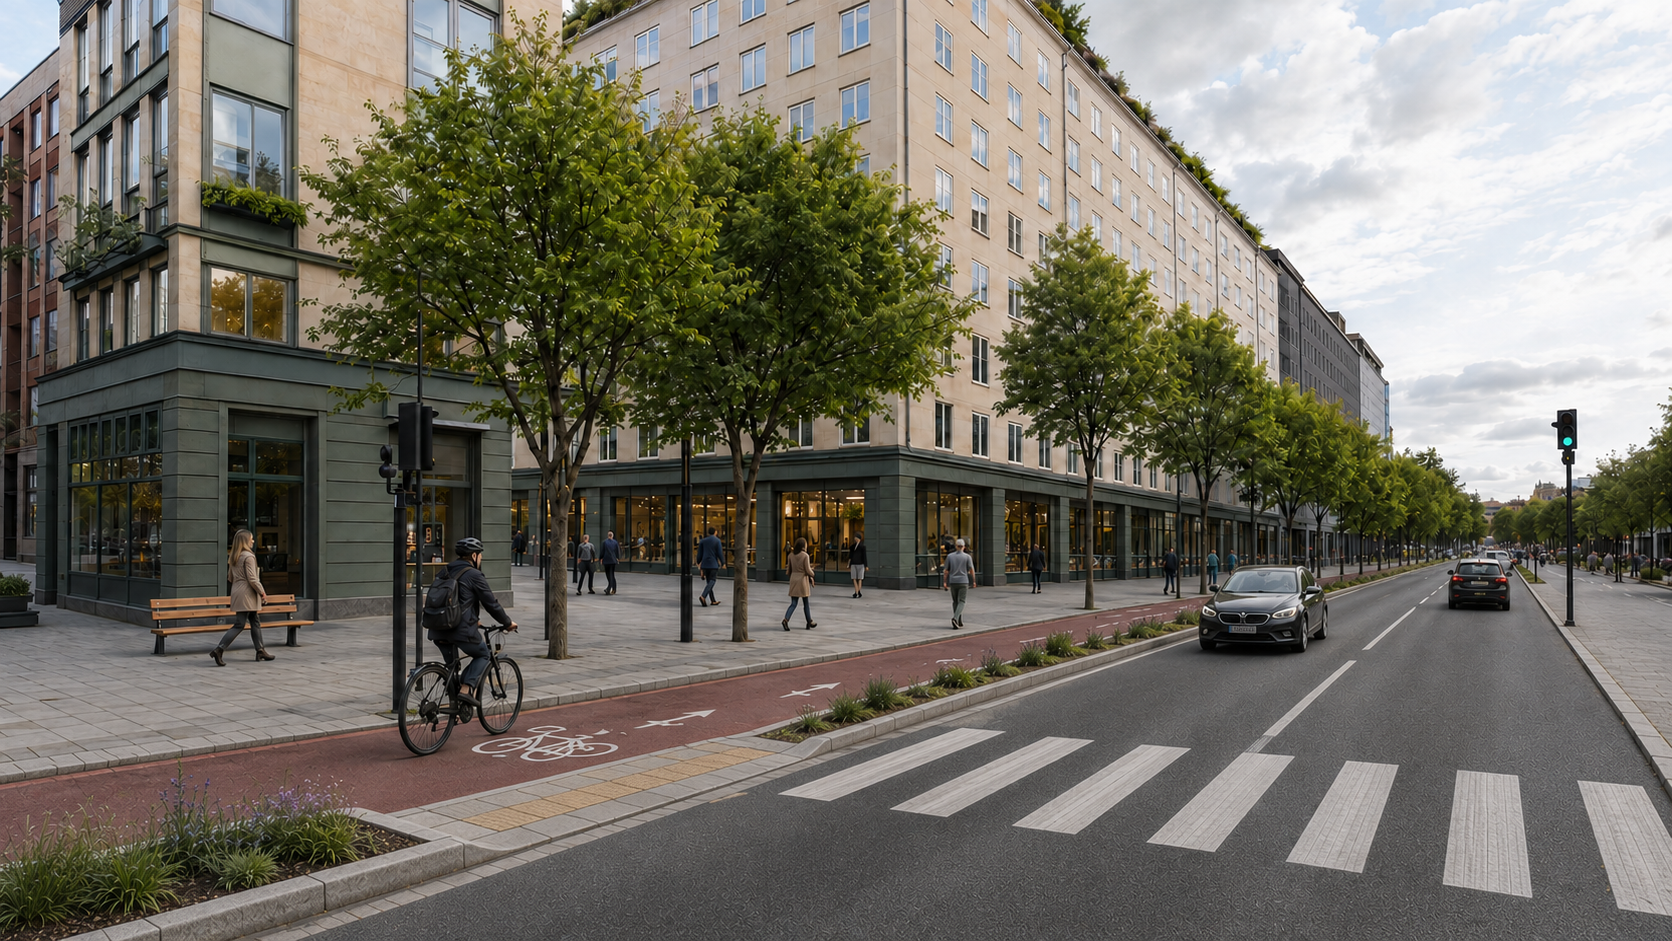
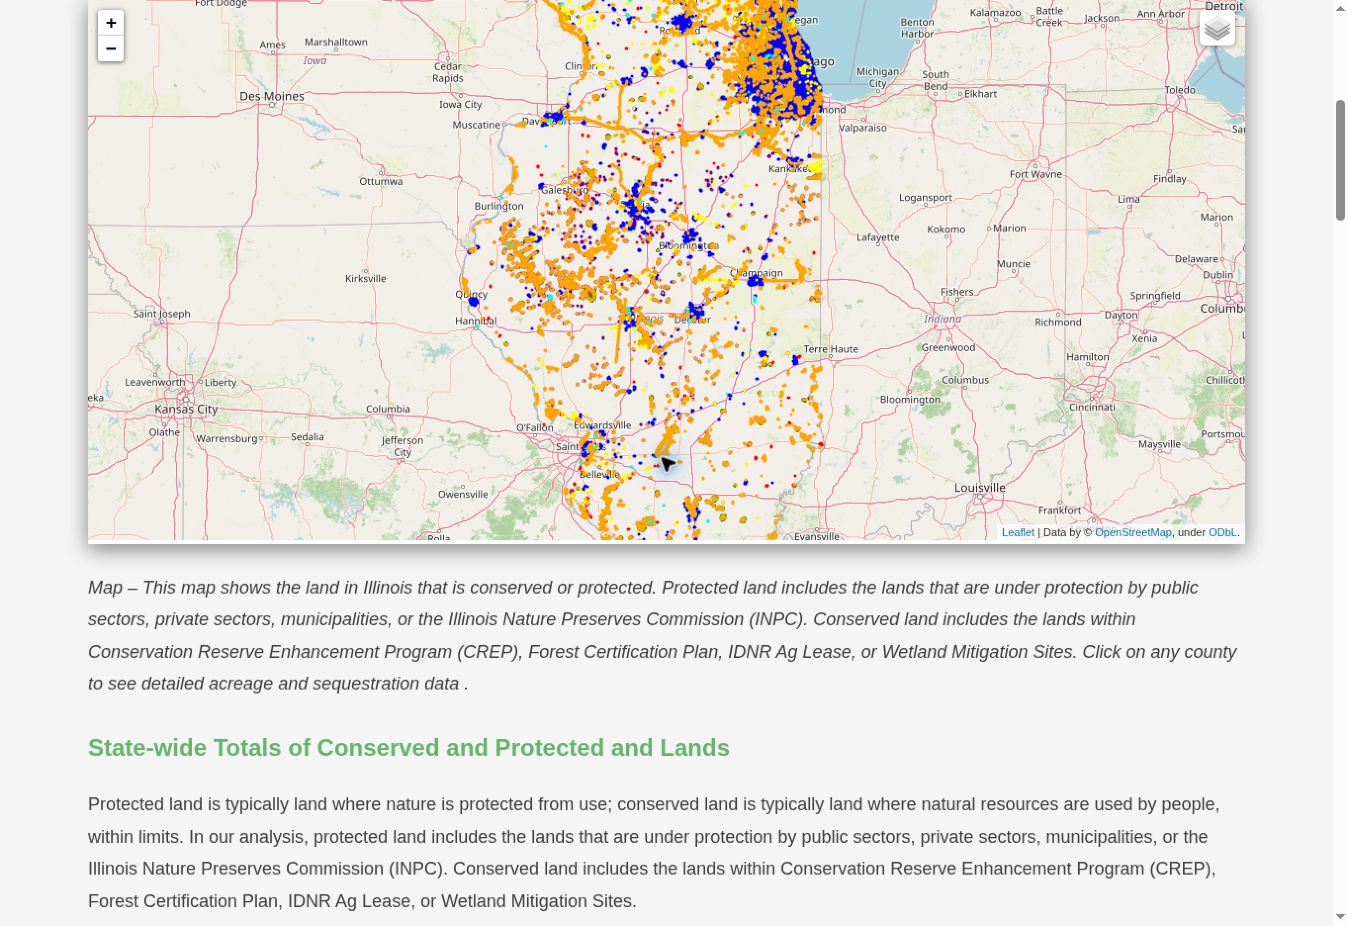
Represent spatial policies as scenario conditions. Compare simulated development with established plans and incorporate protected or conserved land into the policy baseline.
Open the conserved-land assessment ↗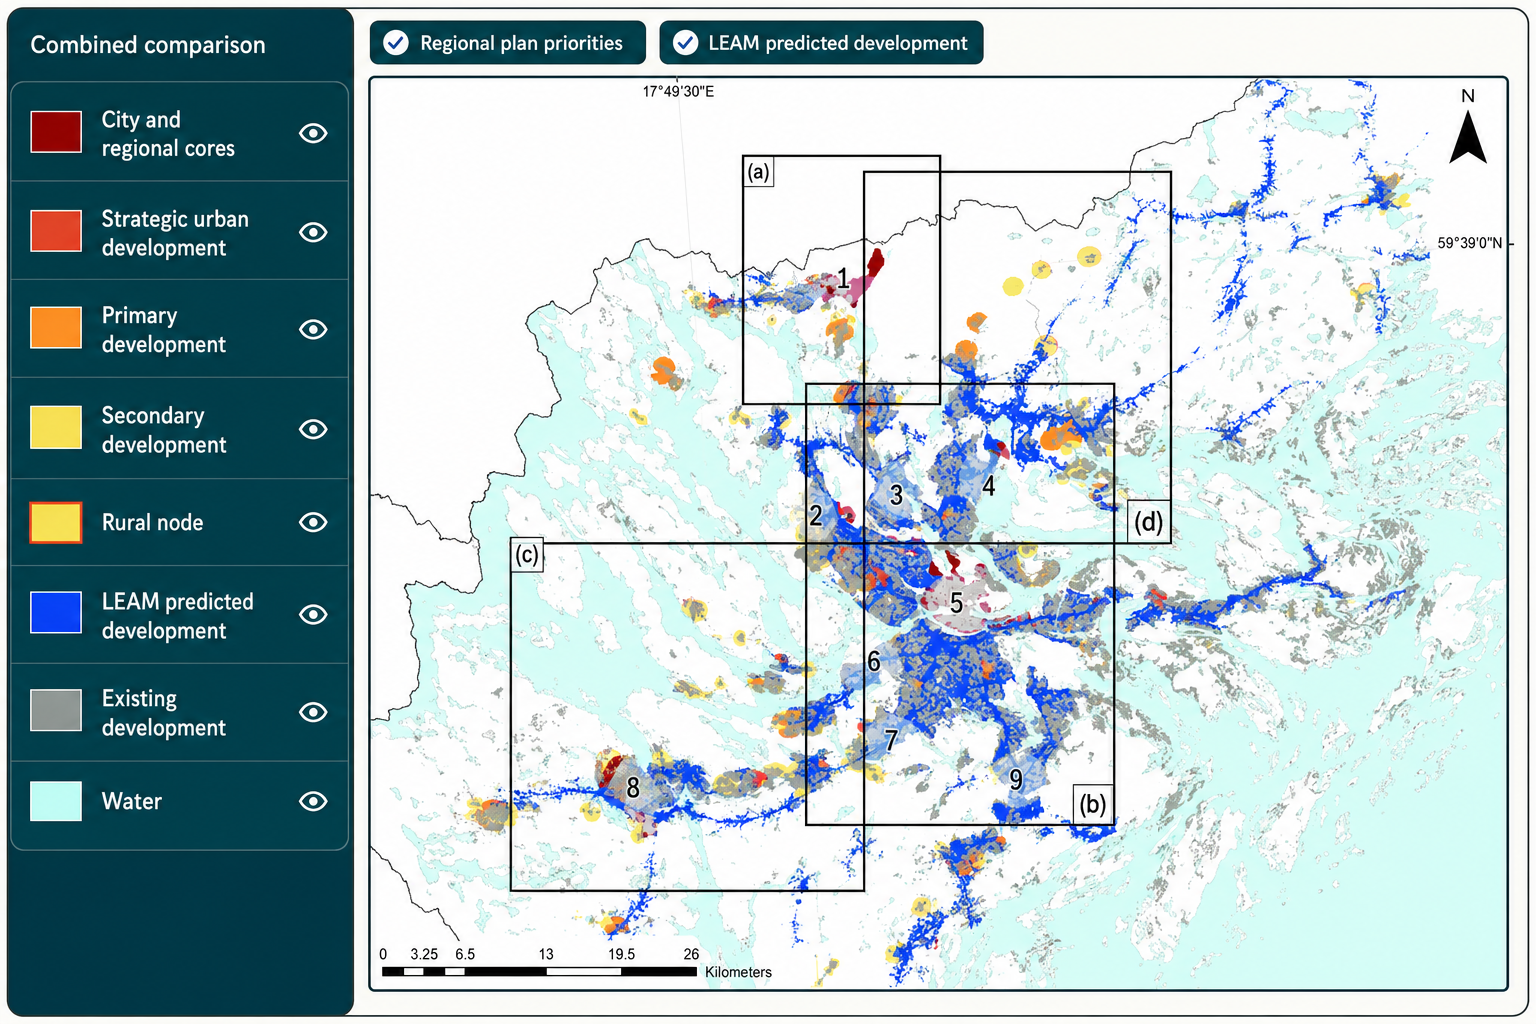
Connect policy measures with uptake assumptions, translate stakeholder concerns into scenario parameters and revise expectations as evidence becomes available.
Each module contributes evidence to the same planning pathway.
Comparing futures
Scenarios help planners examine how different combinations of growth, policy and investment could shape the city. They are structured explorations informed by explicit assumptions.
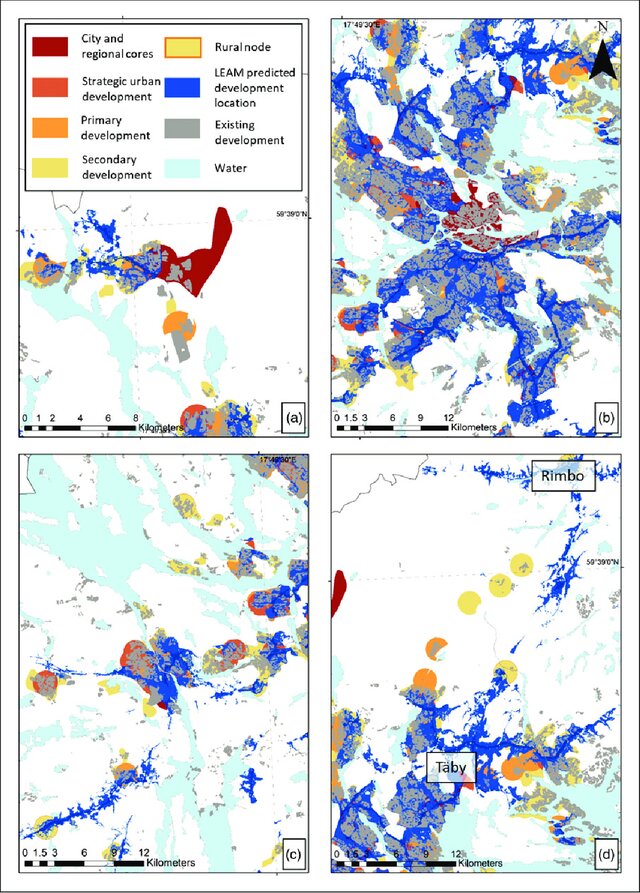
Development and travel patterns continue broadly along existing trends, with currently adopted measures.
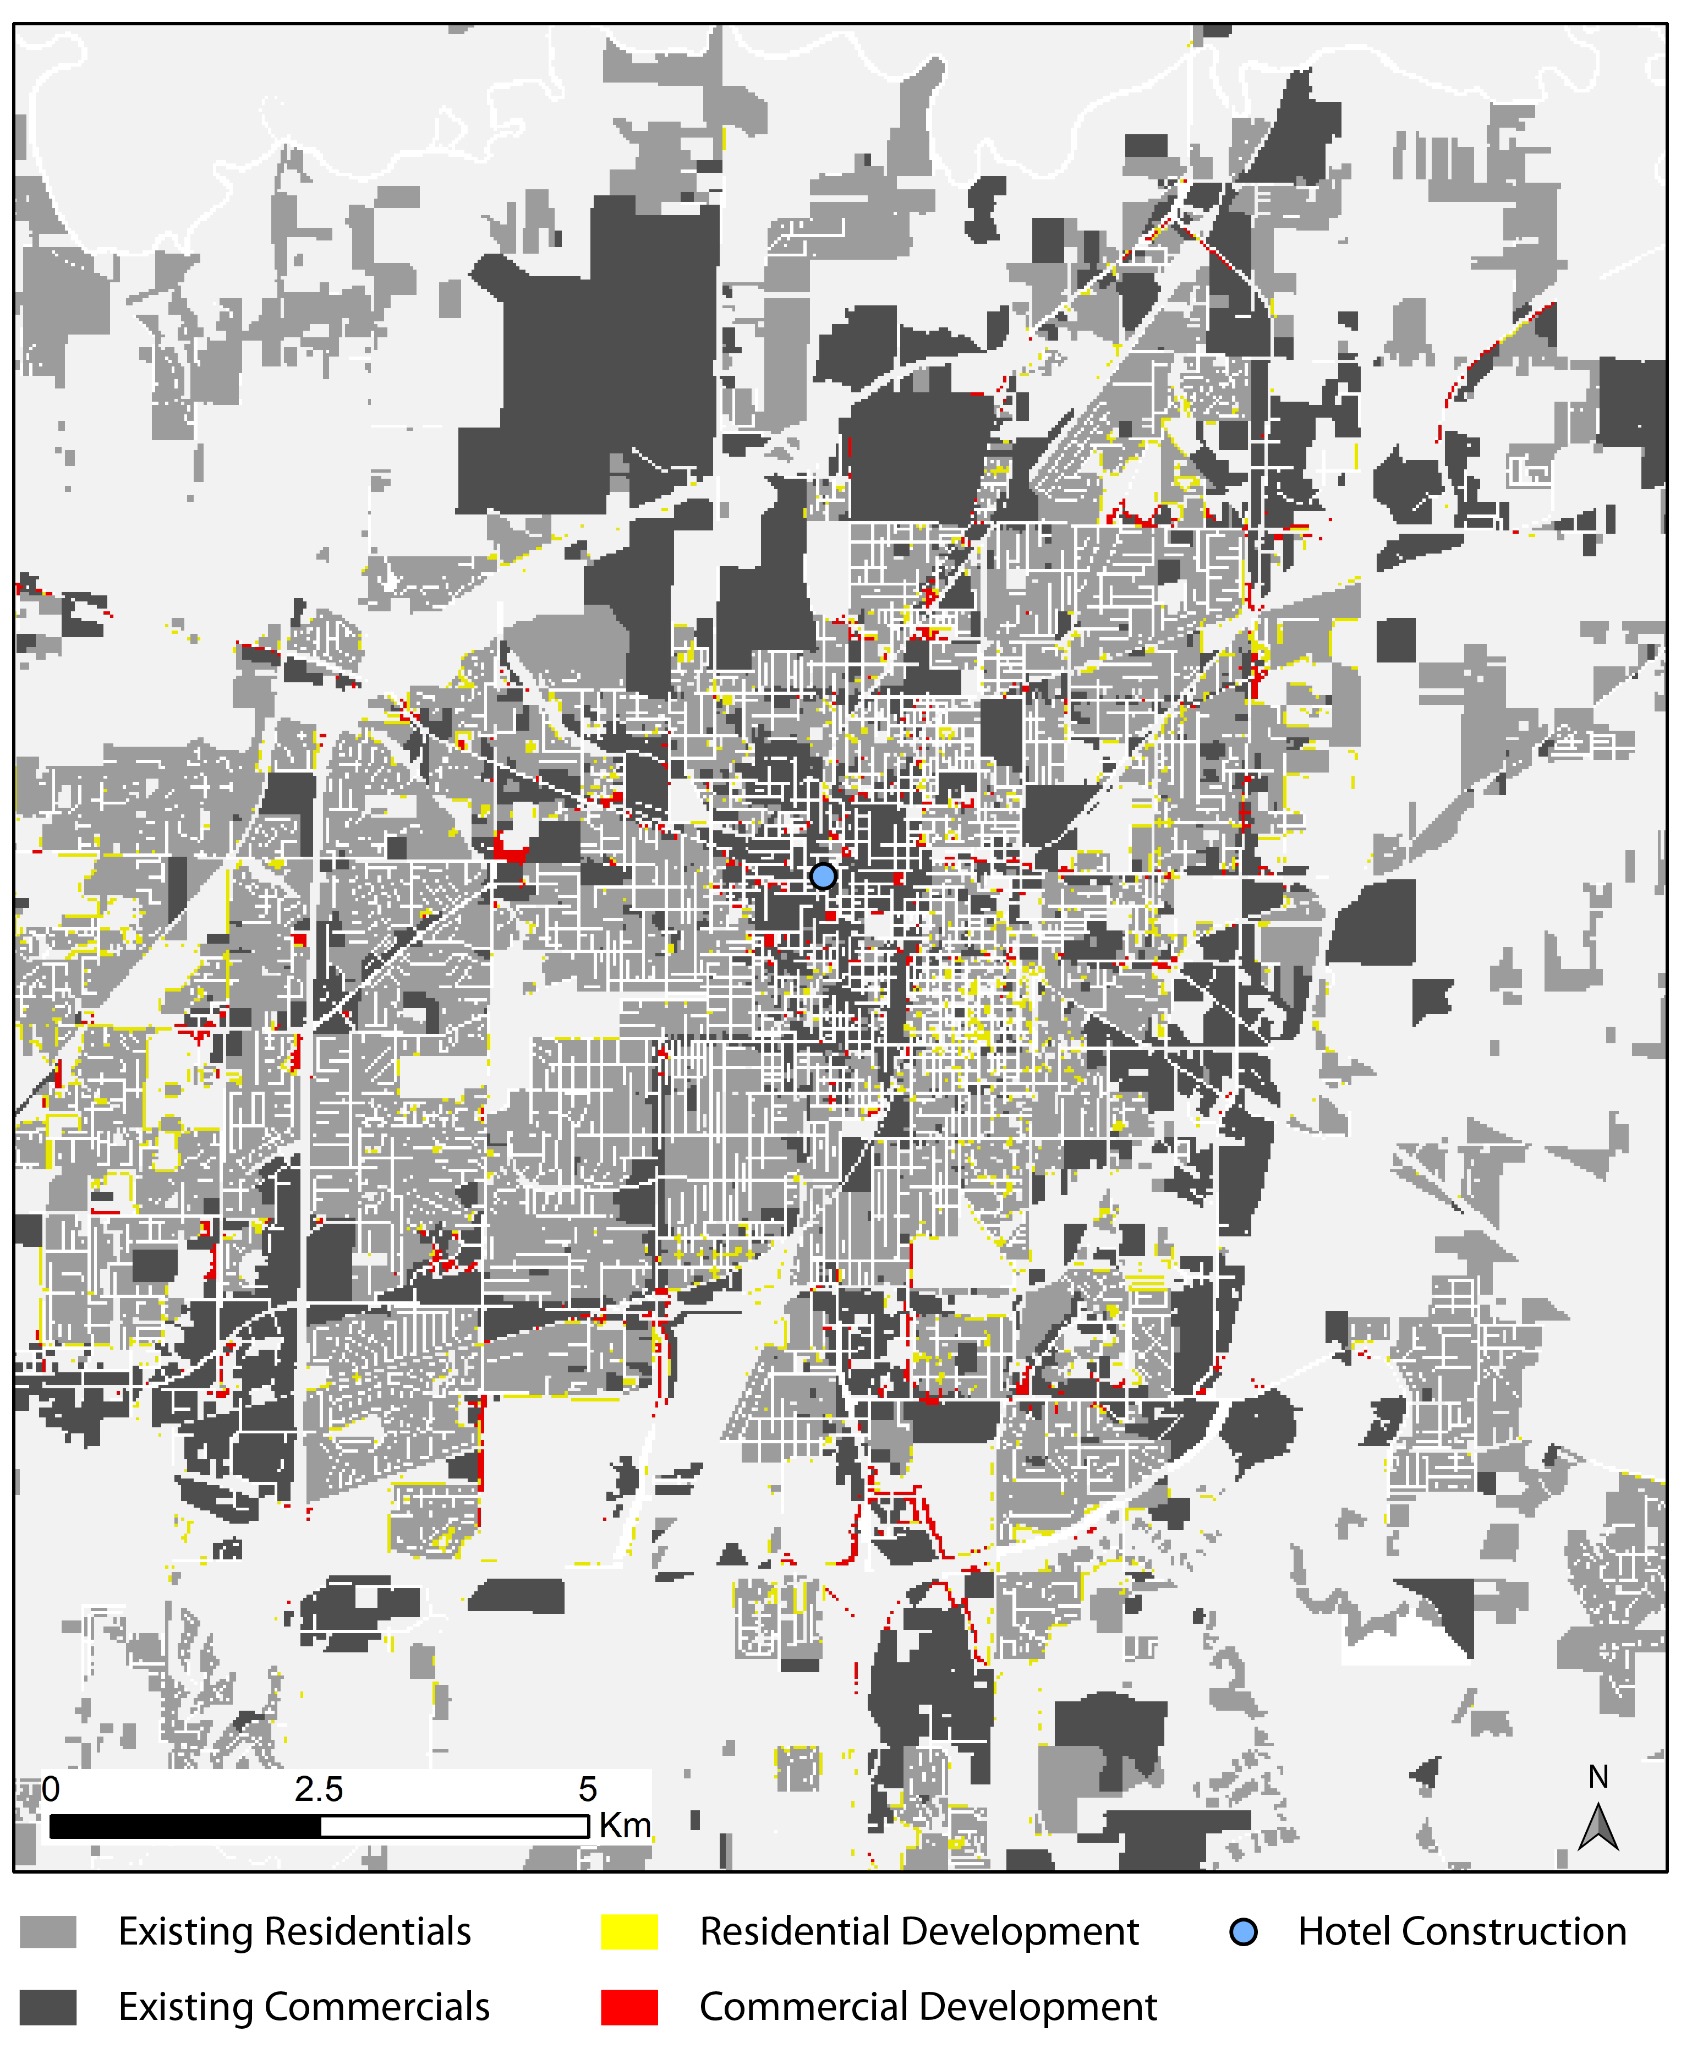 Expand map ↗
More development is directed toward existing centres, services and public-transport connections.
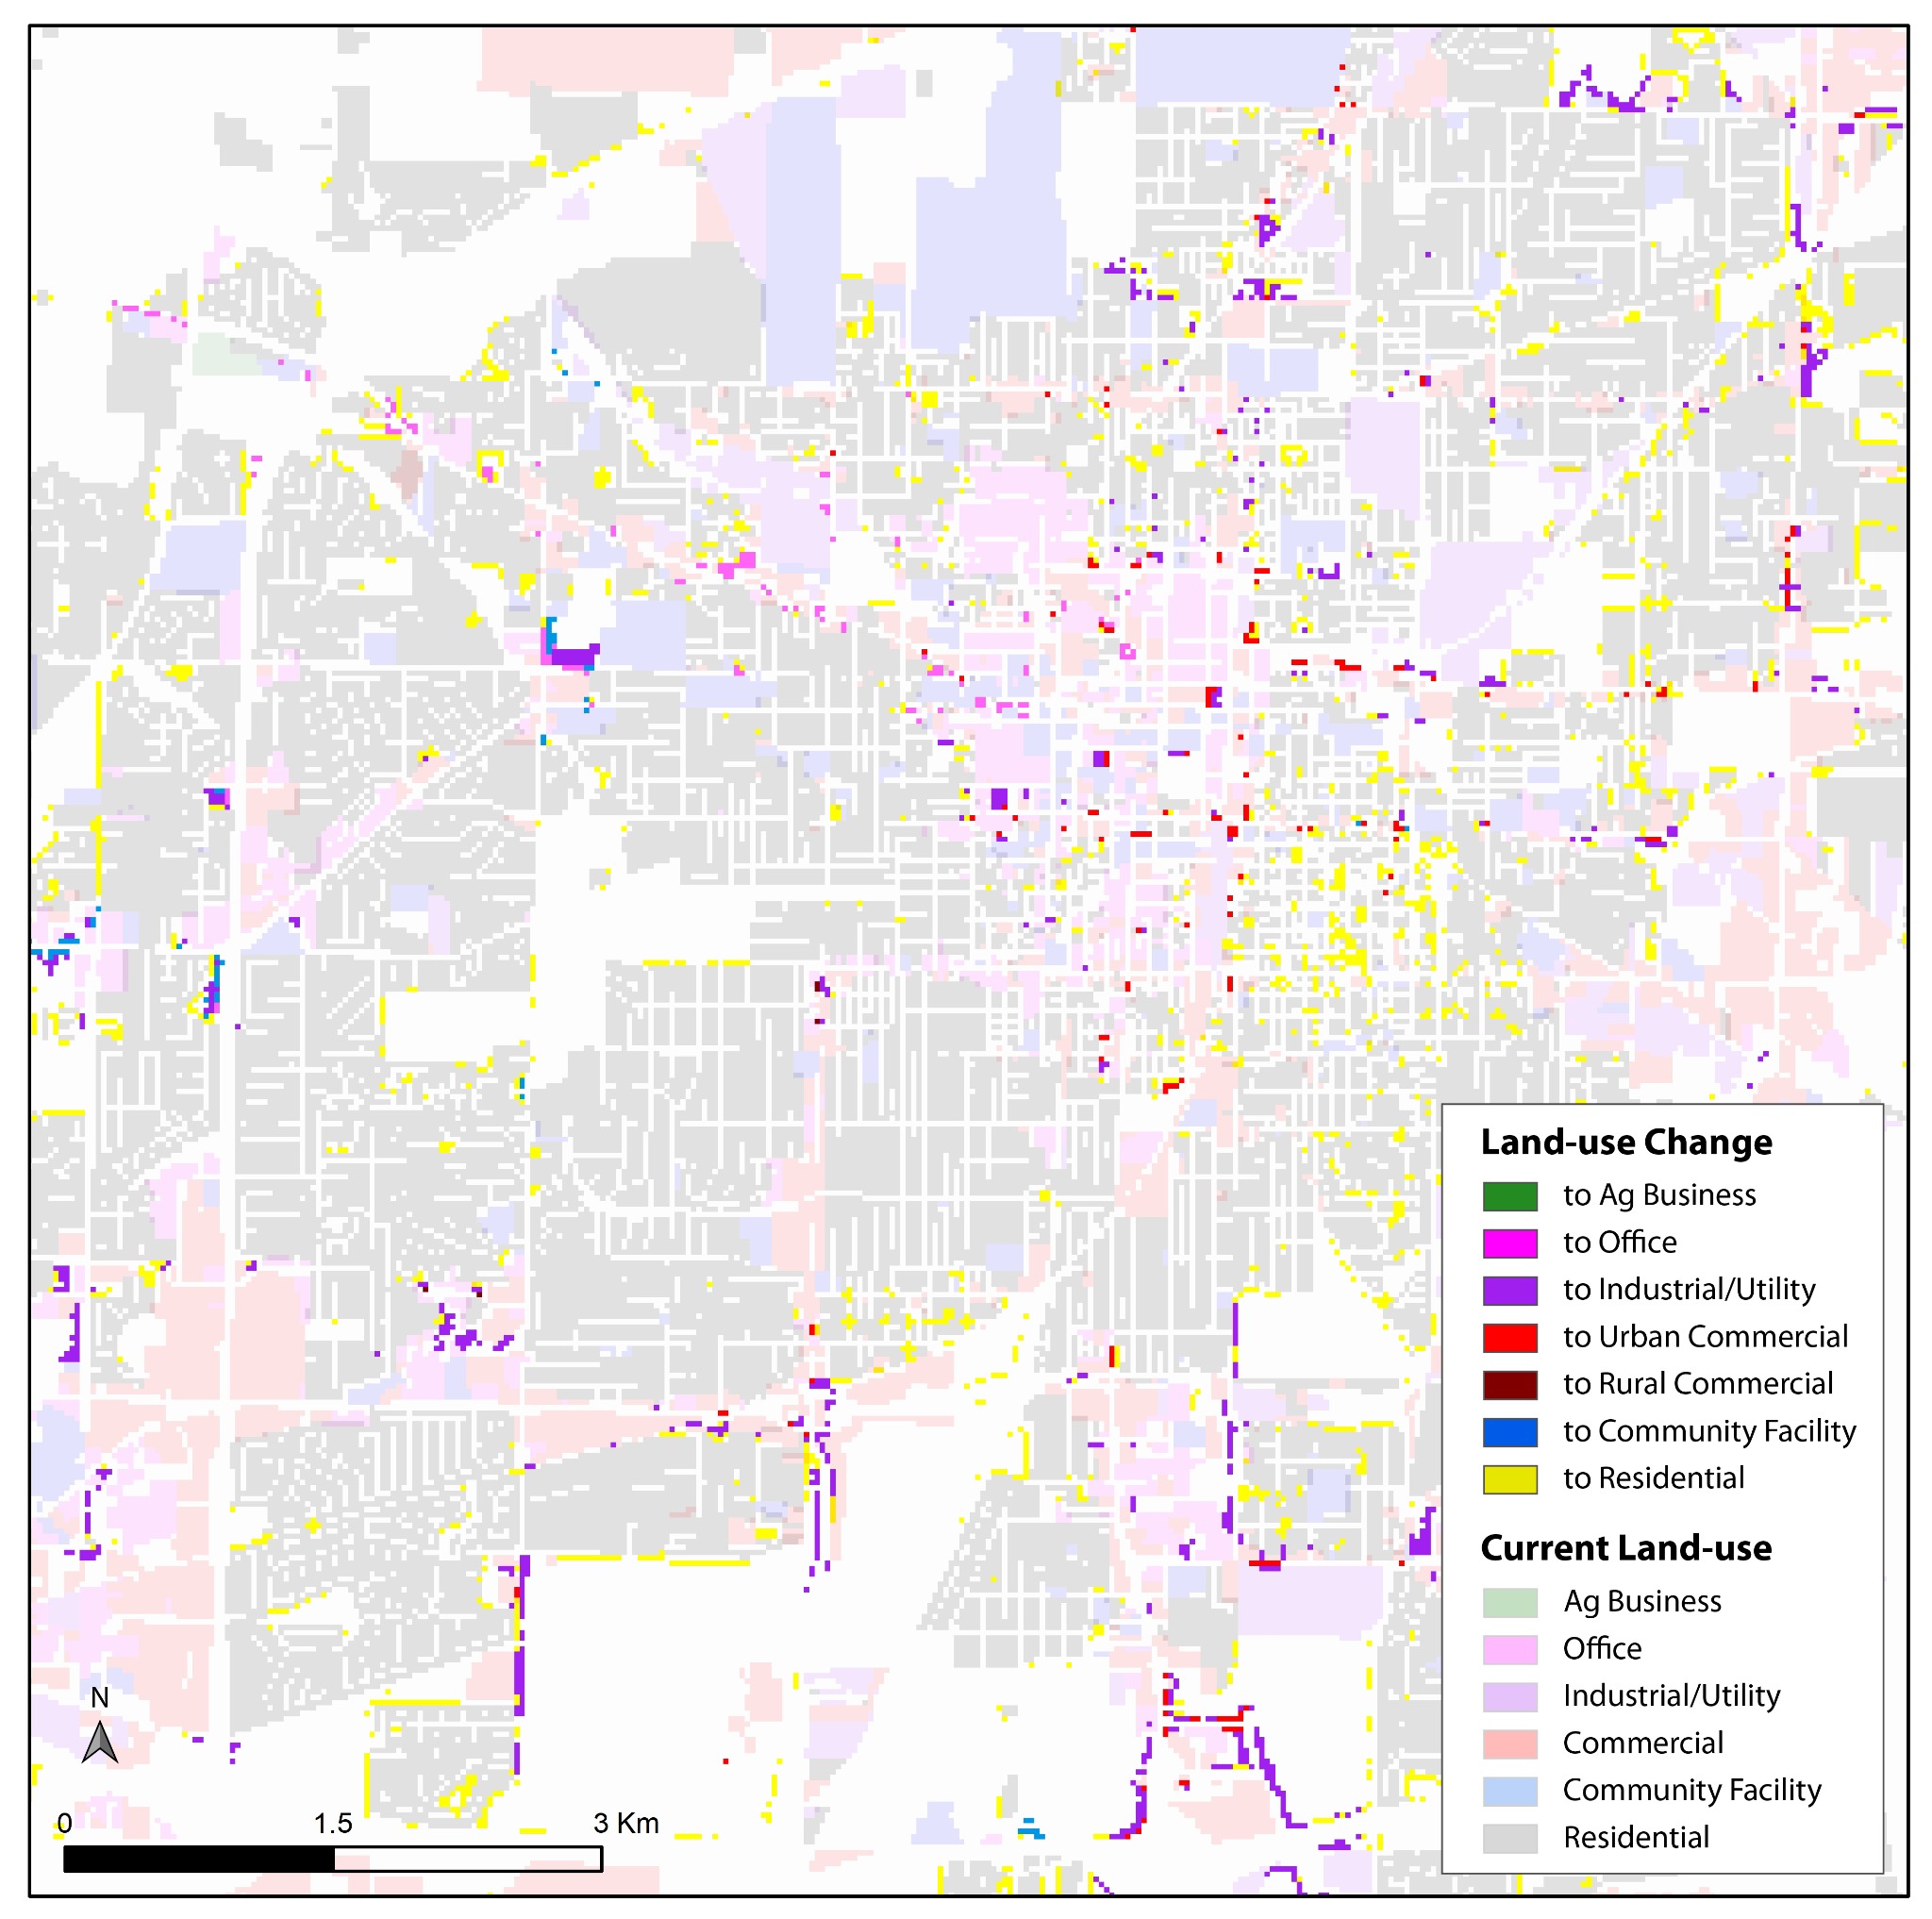 Expand map ↗
Development is coordinated with green infrastructure, ecosystem protection, active mobility and targeted renewal.
 Expand map ↗
Landscape restoration
Urban climate pathways can include ecosystem restoration alongside changes to buildings, transport and development.
These tools support exploratory scenario assessment. Their outputs should be considered alongside local evidence, planning processes and stakeholder knowledge.
Existing tools and resources
The Explorer brings together existing applications, project examples and learning materials. Each resource opens at its source in a new tab.
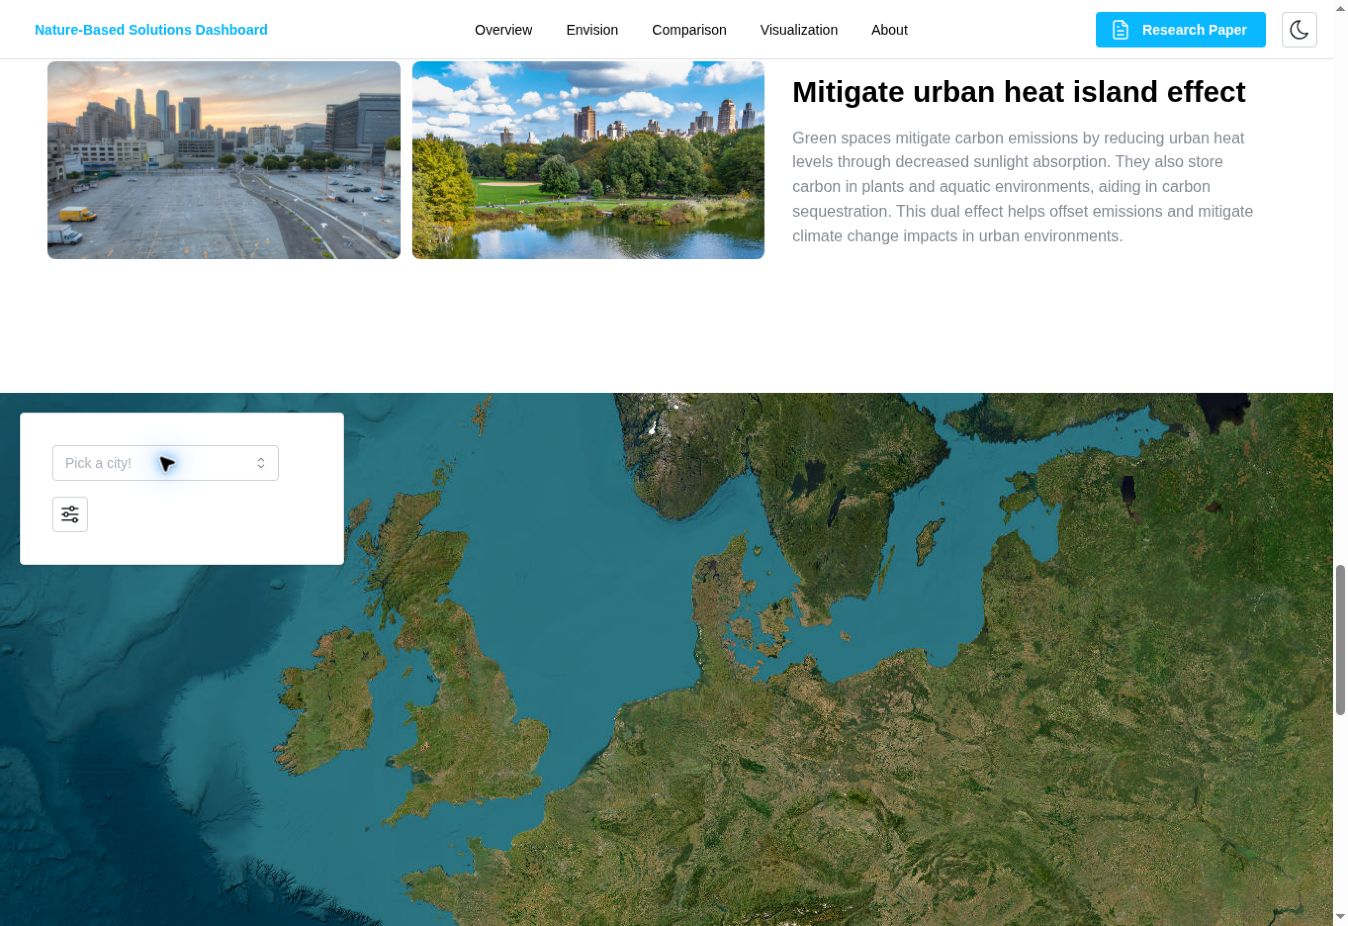
Explore spatial indicators and the allocation and visualization of urban nature-based solutions.
Open dashboard ↗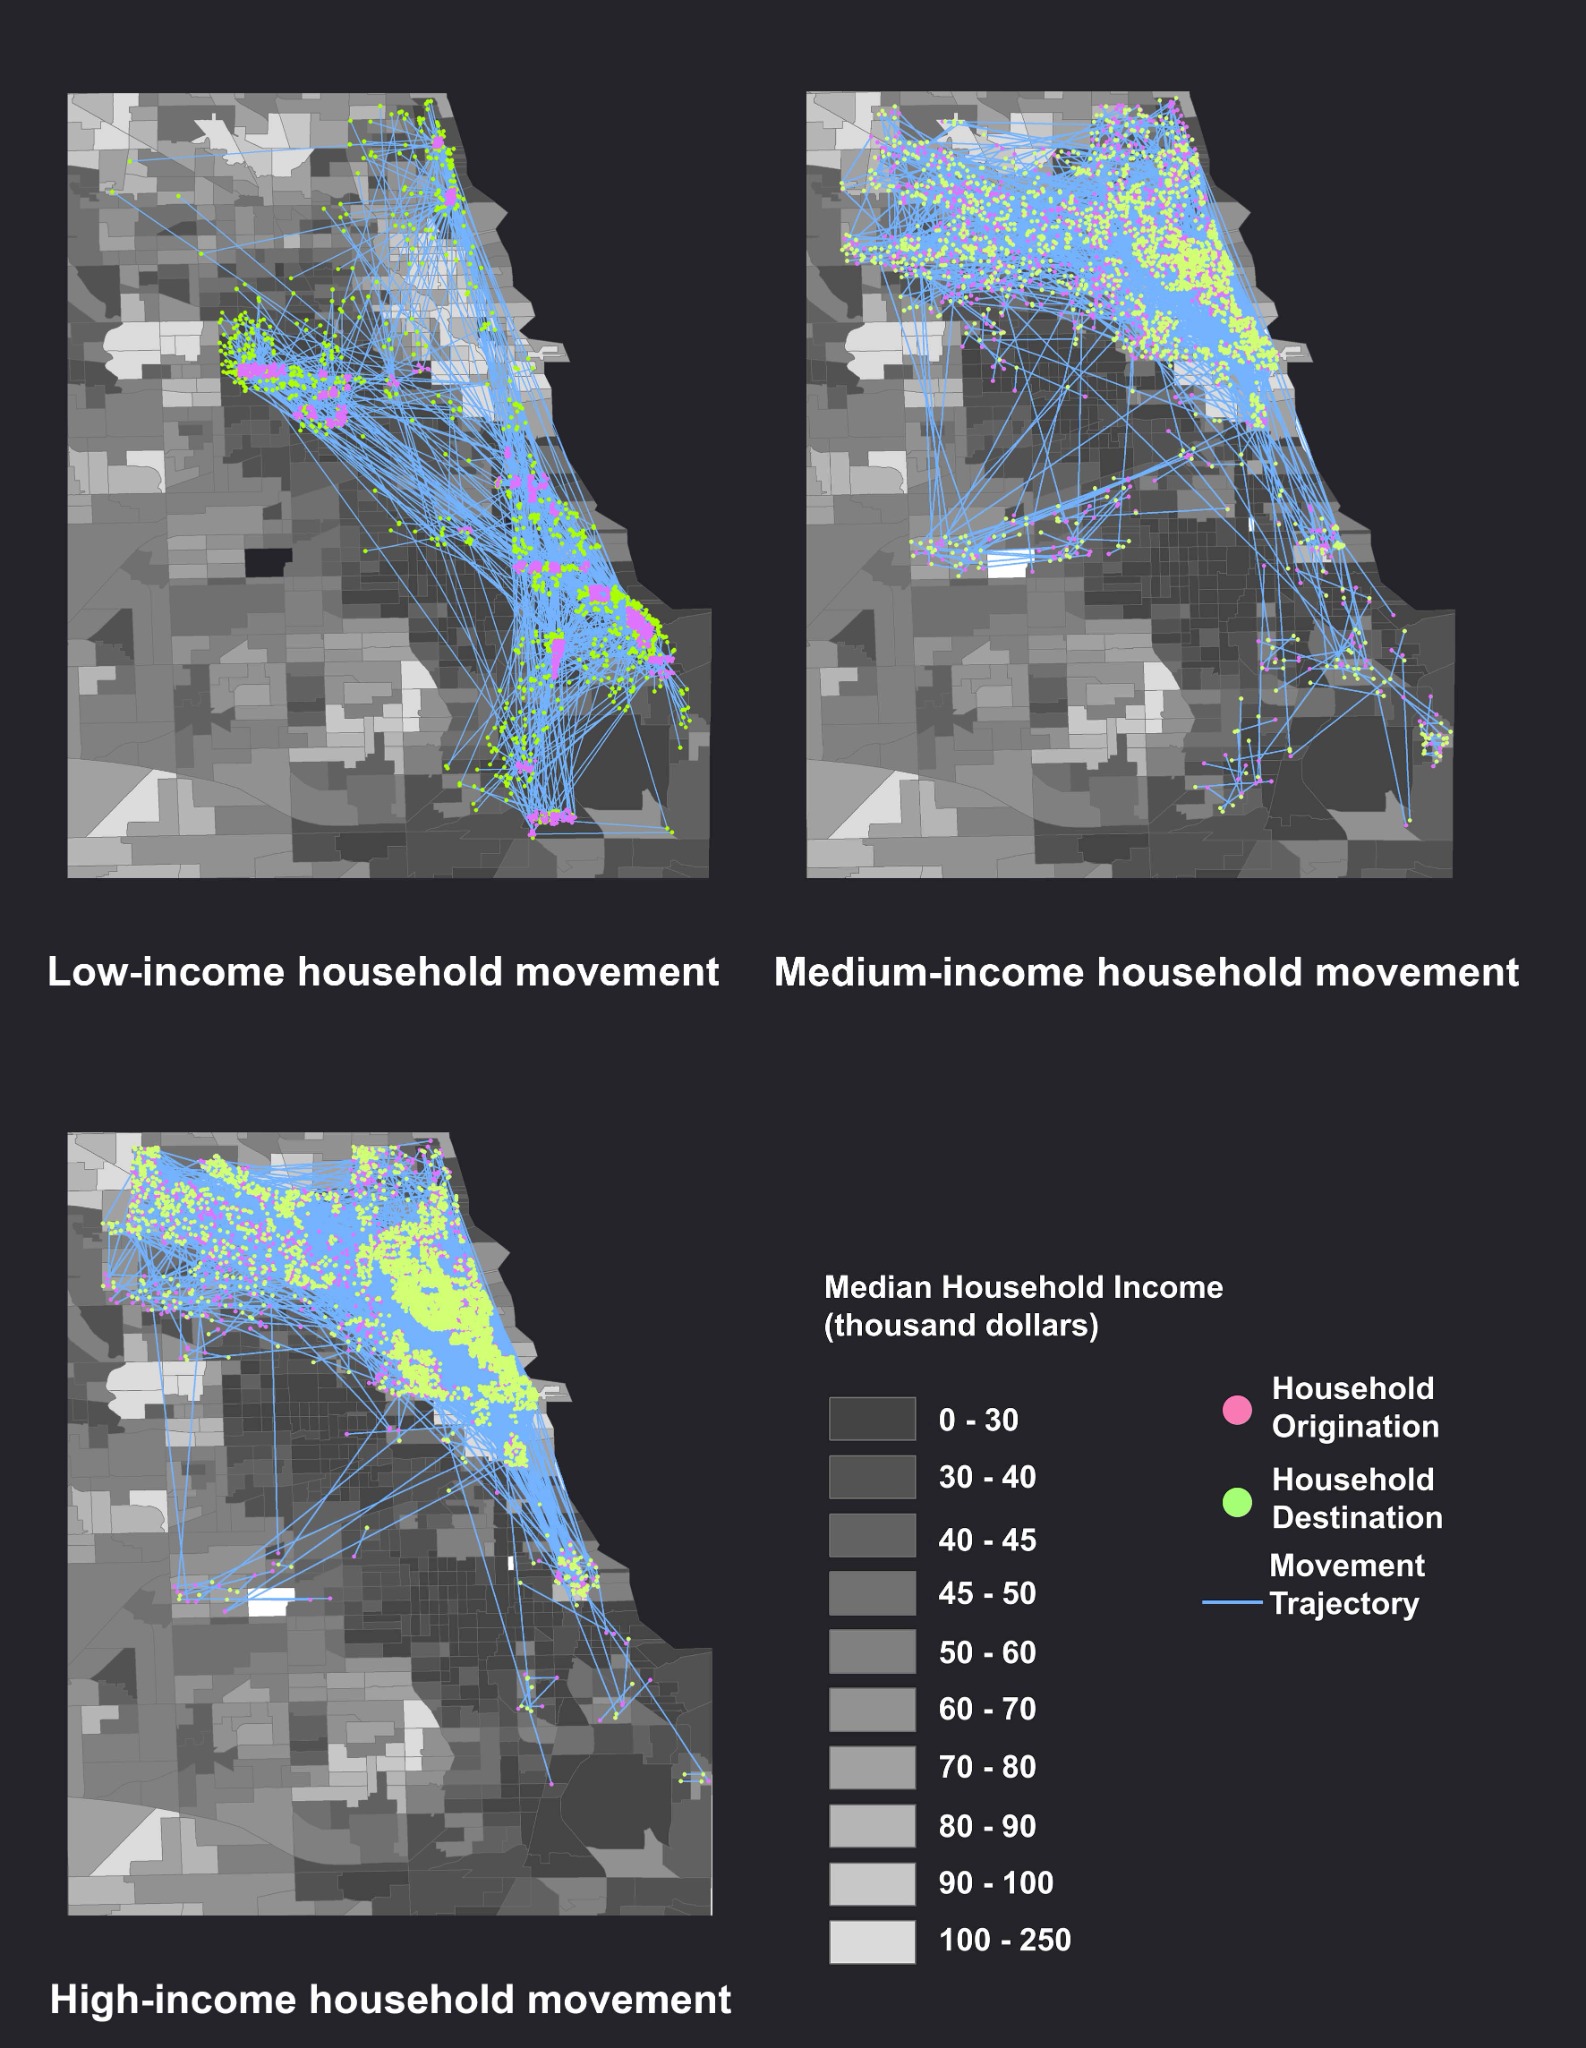
Examine last-mile transportation choices and associated emissions.
Project-owned fallback visualOpen tool ↗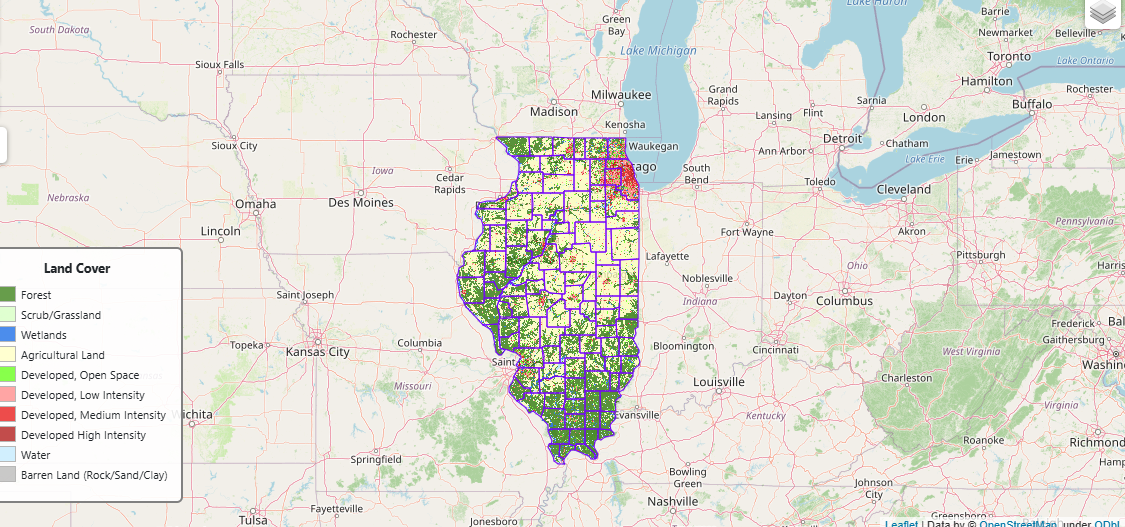
Learn about the Land-use Evolution and Impact Assessment Model and its applications.
Project-owned fallback visualVisit website ↗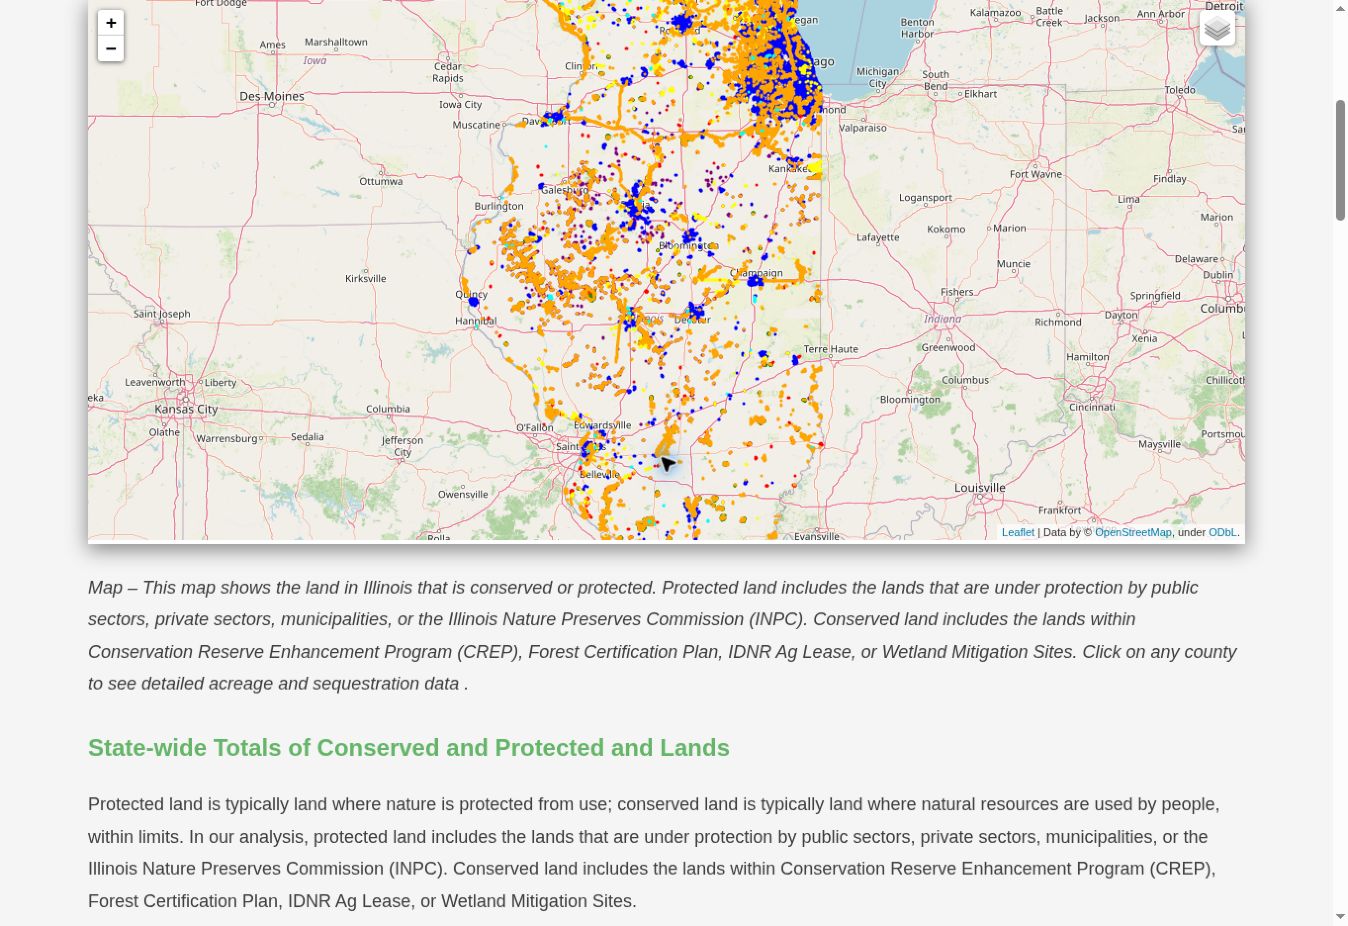
Examine conserved land, protection programmes and estimated carbon sequestration.
Open assessment ↗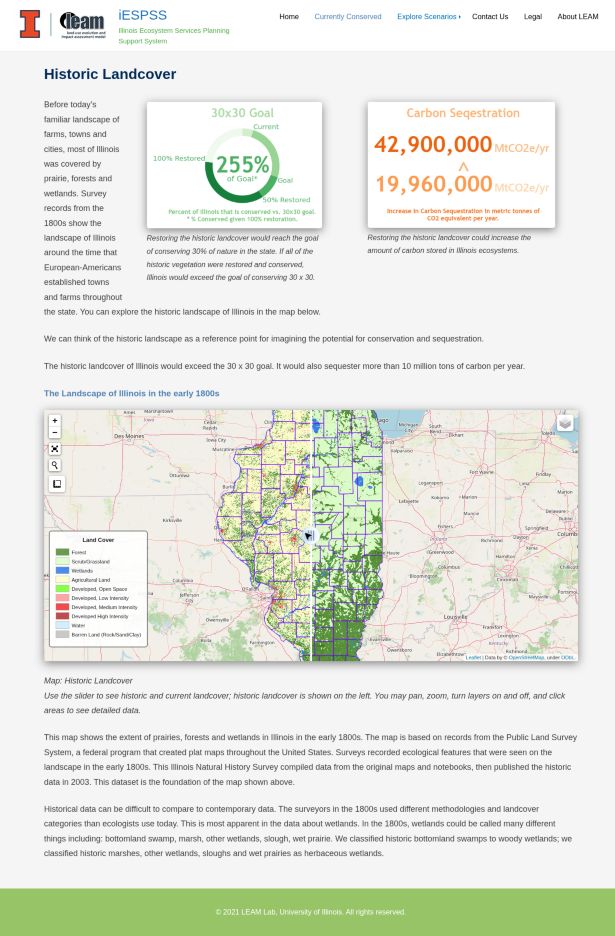
Compare historic and current land-cover patterns and use the historic landscape as a scenario reference.
Open explorer ↗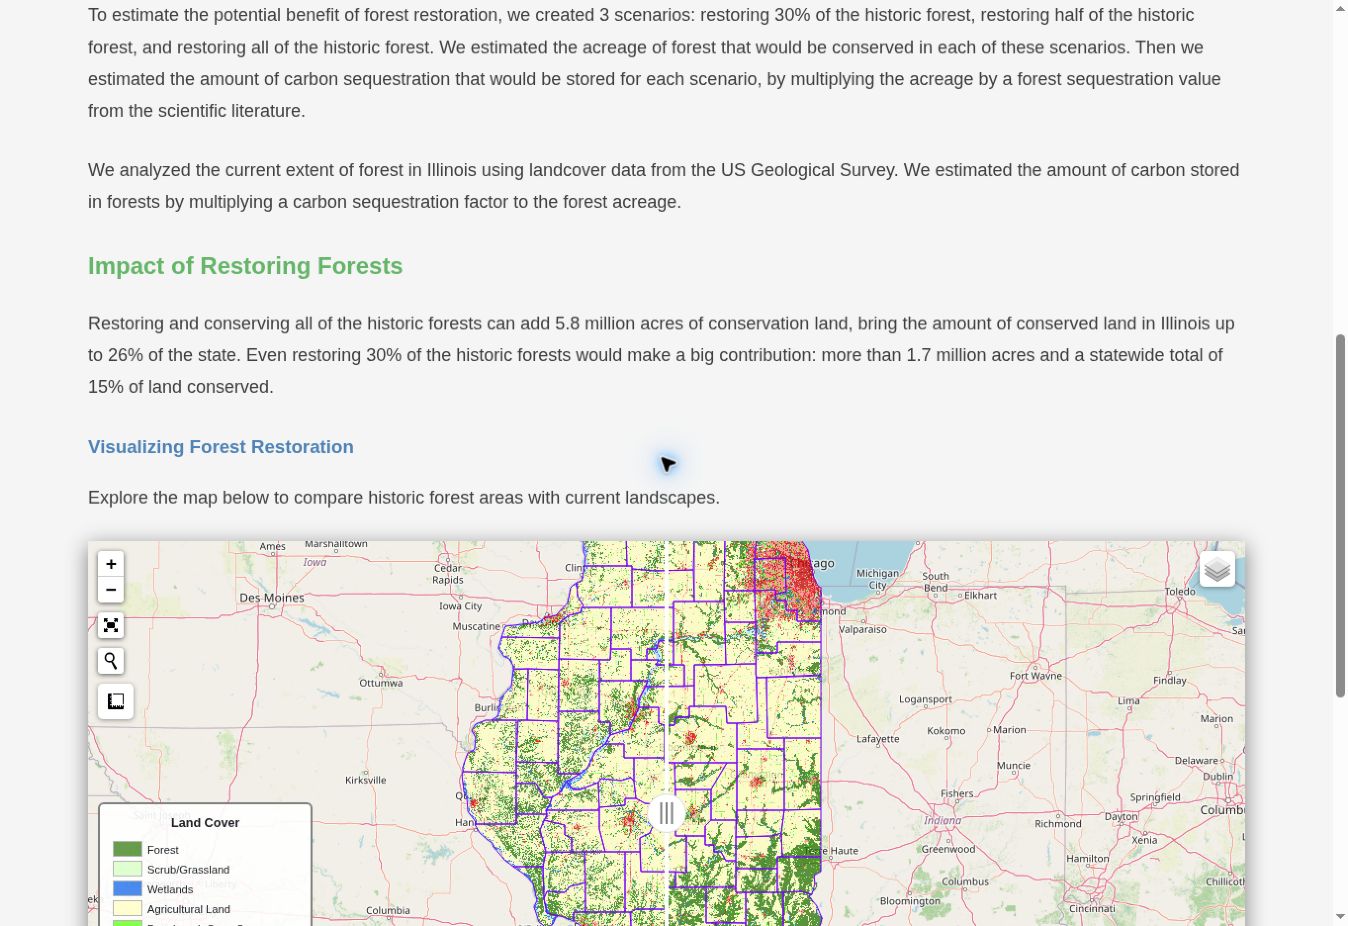
Compare forest-restoration scenarios and their estimated conservation and carbon outcomes.
Open scenarios ↗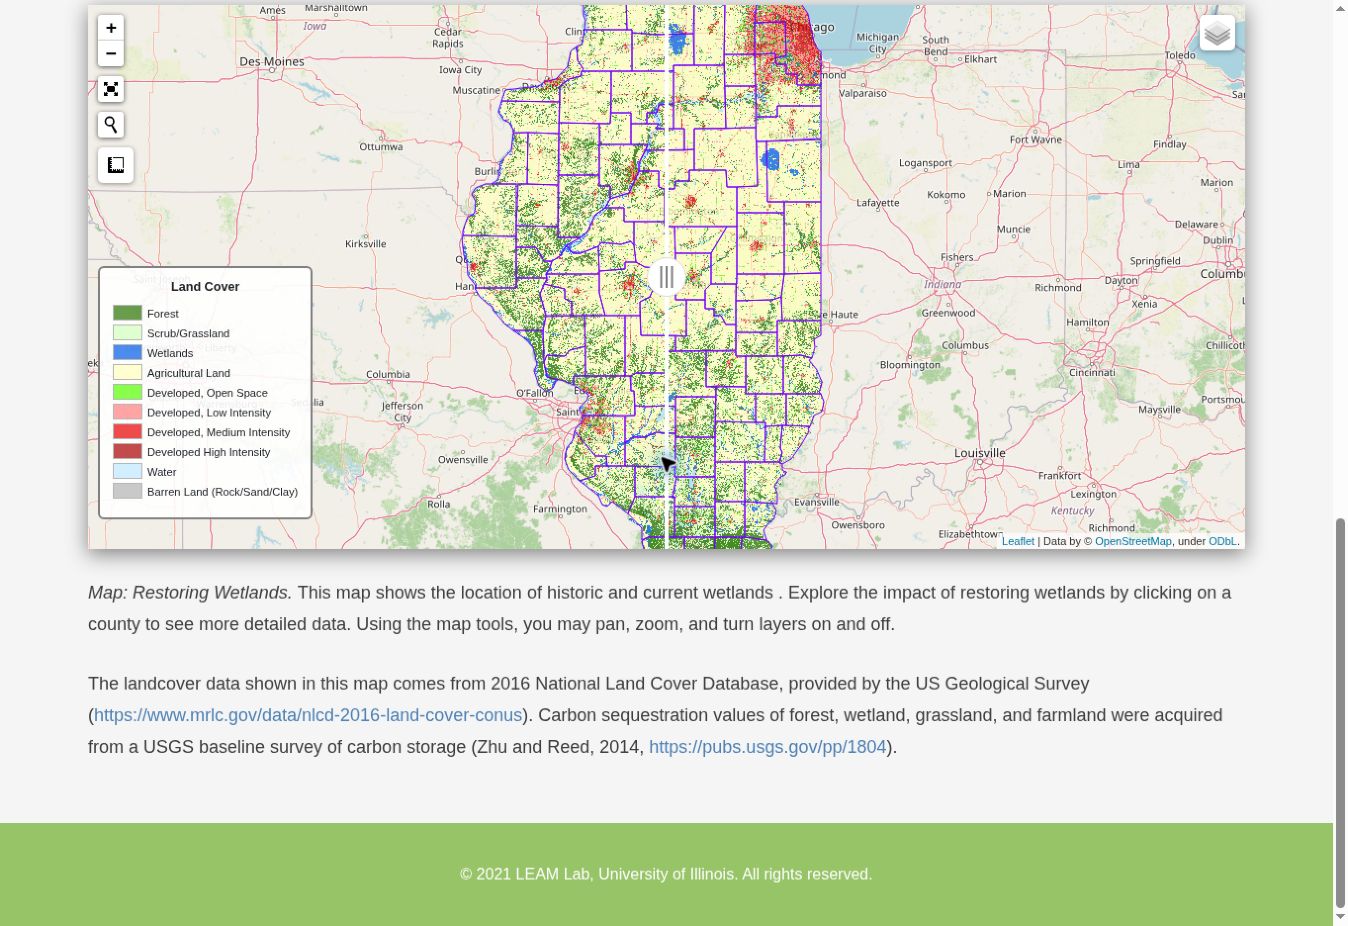
Explore historic and current wetlands and the implications of wetland restoration.
Open scenarios ↗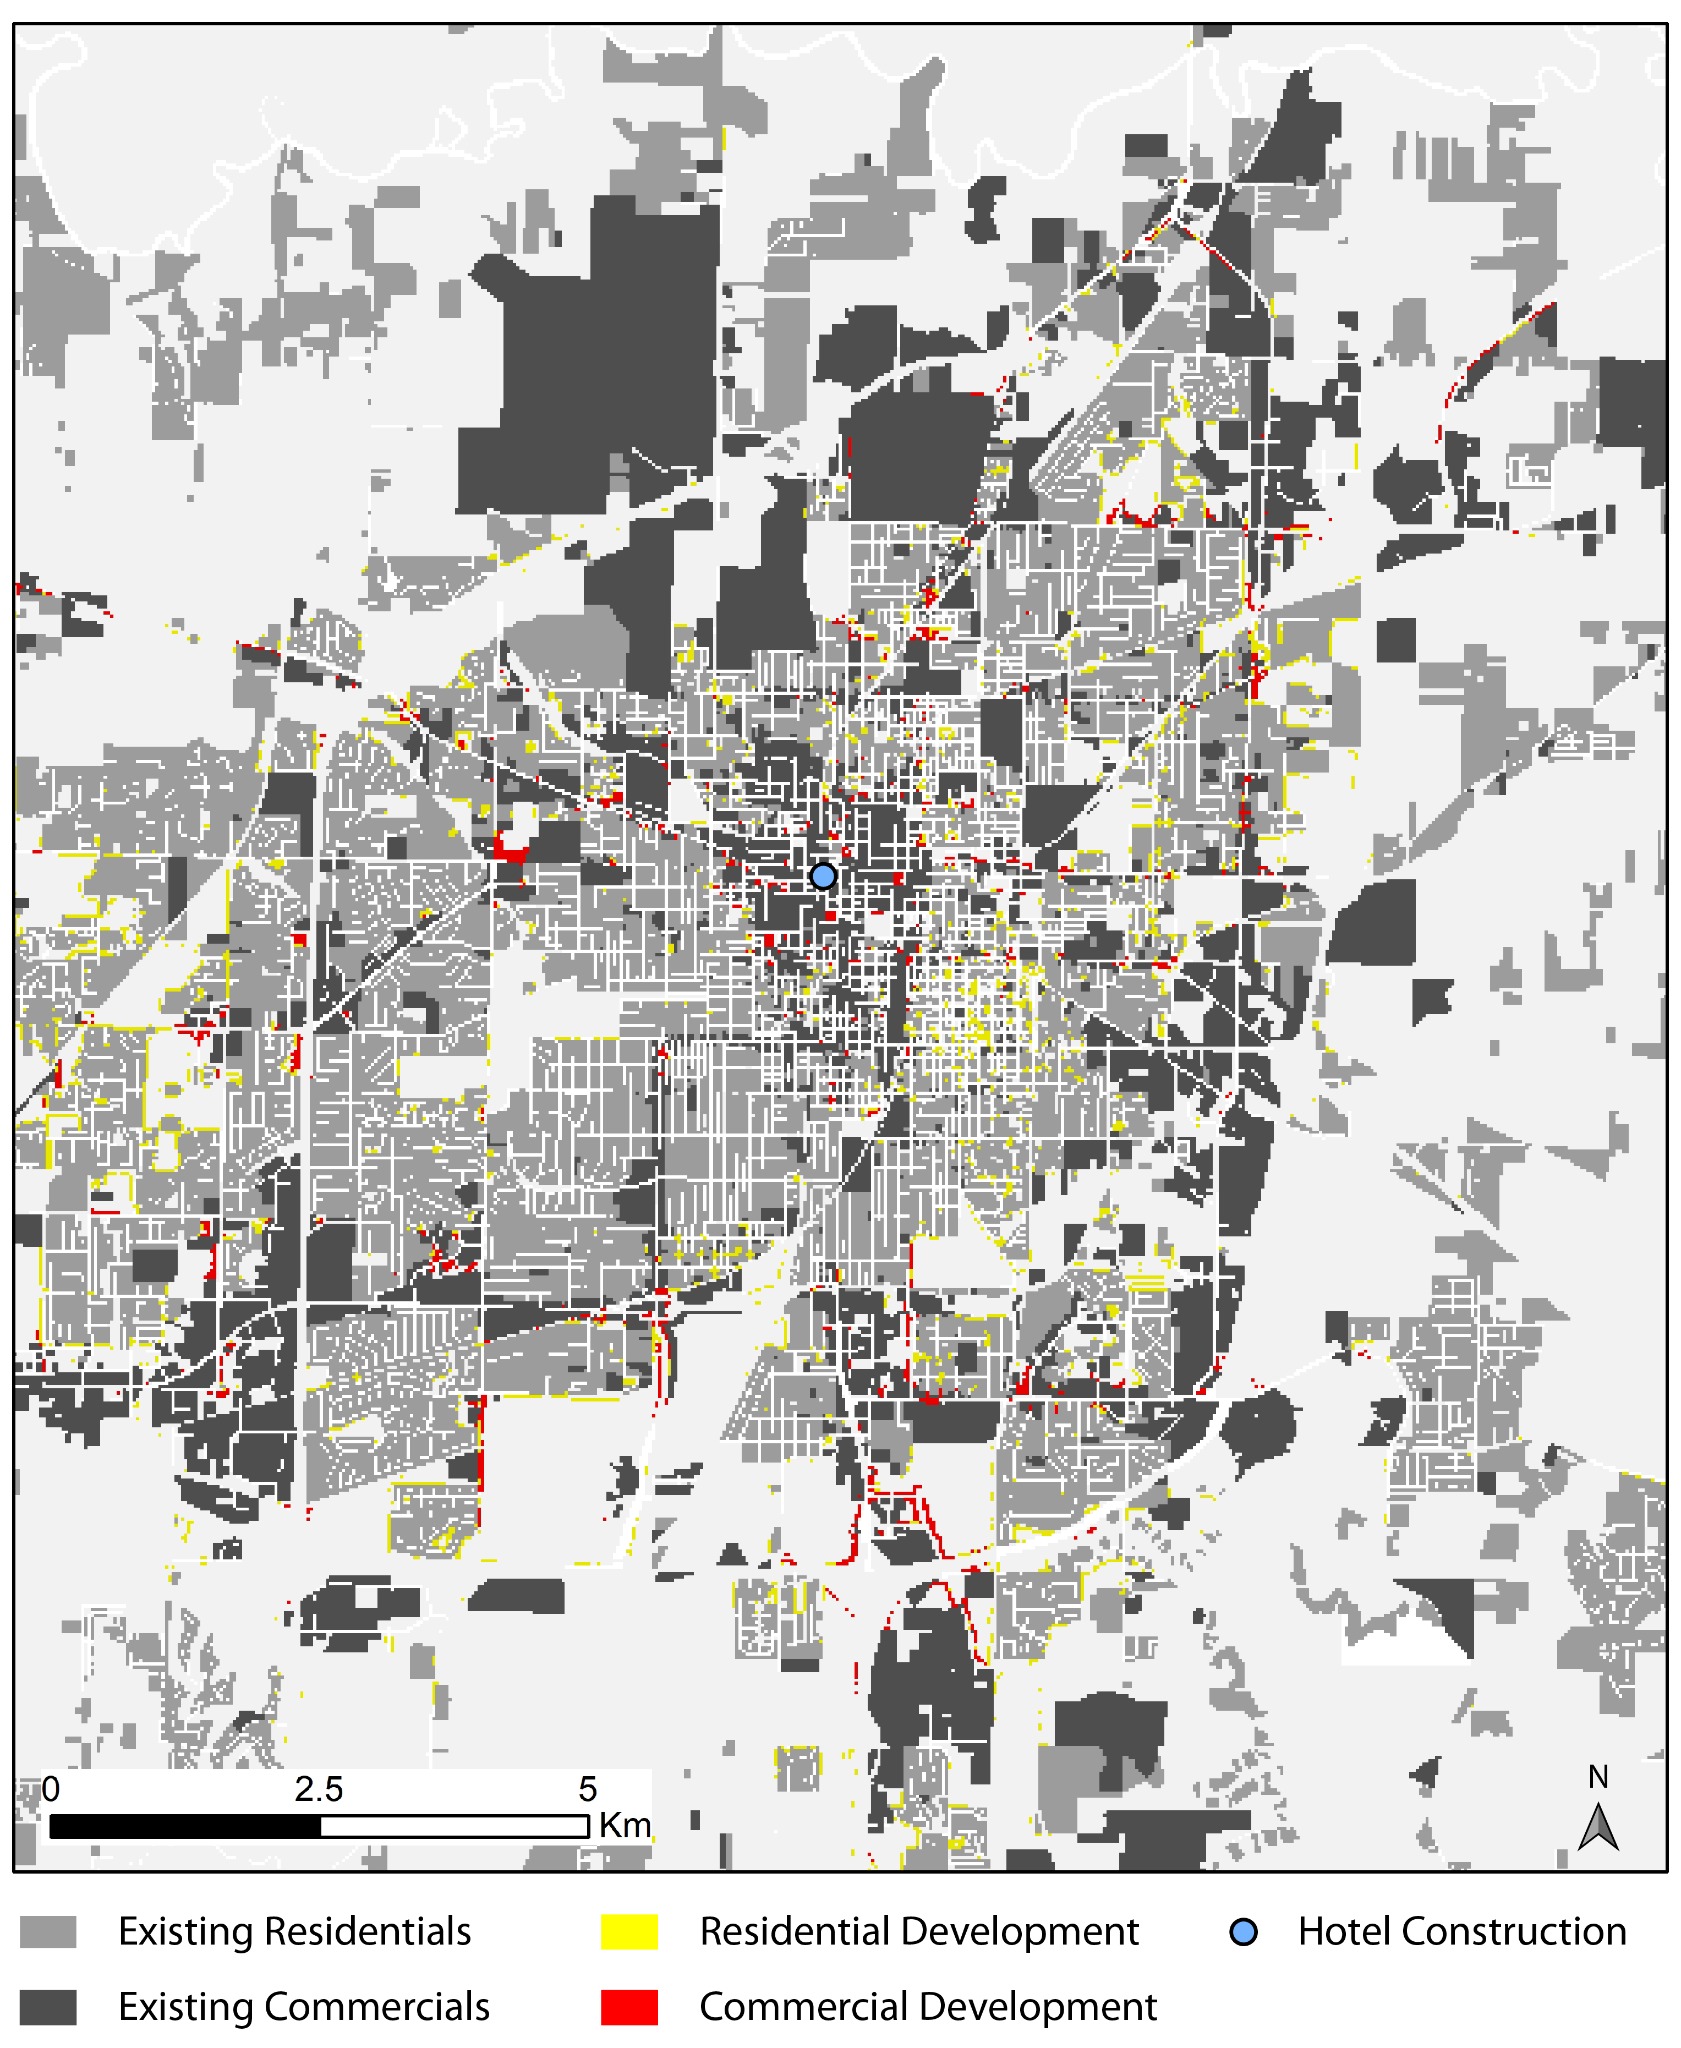
Follow a guided introduction to a previous LEAM land-use application.
Project-owned fallback visualStart the tour ↗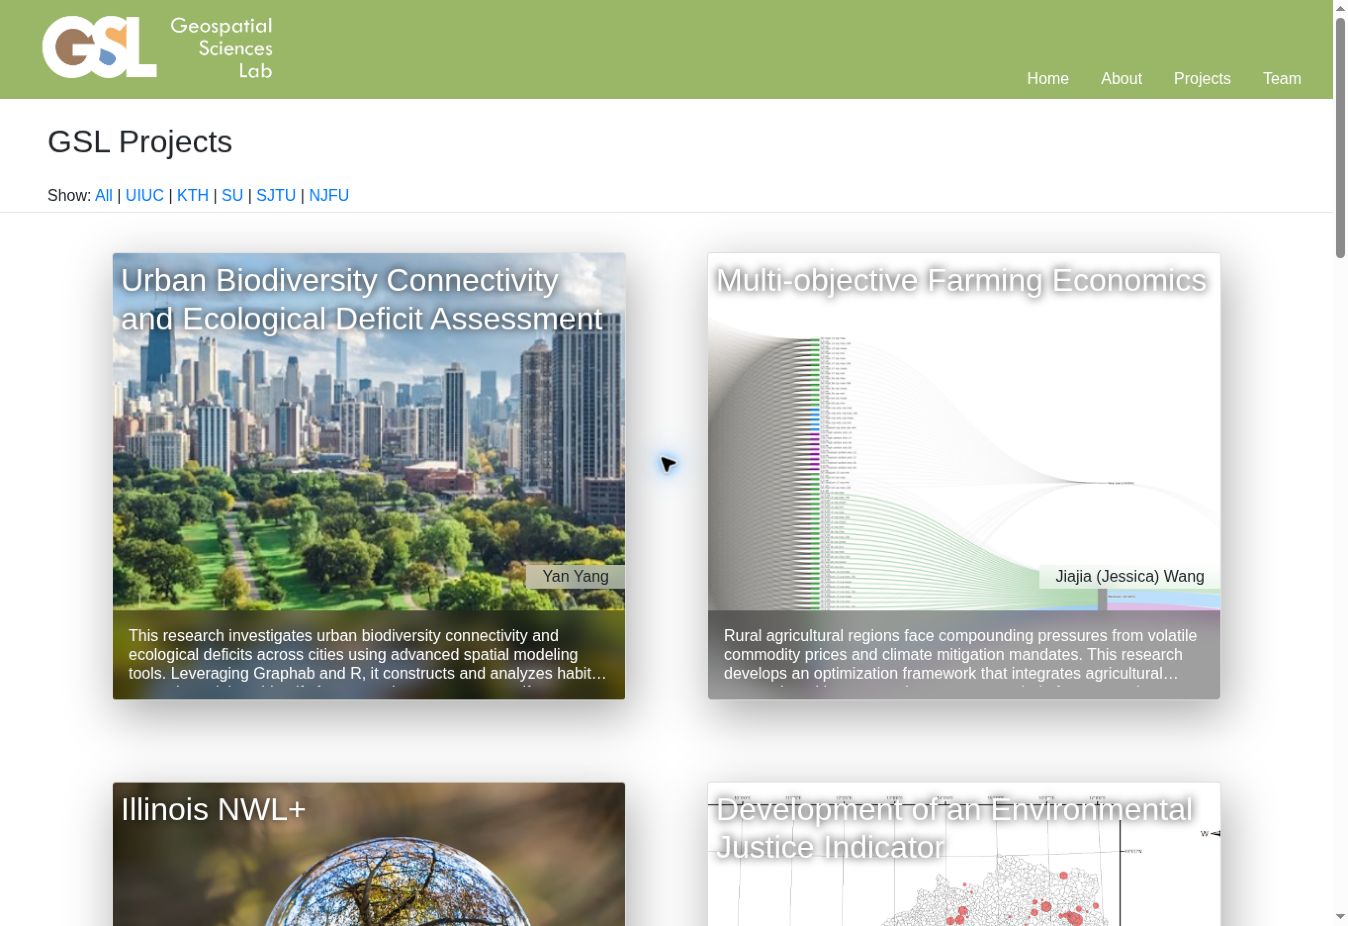
Explore examples of spatial modelling, planning-support and environmental applications.
View projects ↗Learn how the land-use model is configured and used.
PDF · legacy endpointOpen technical guide ↗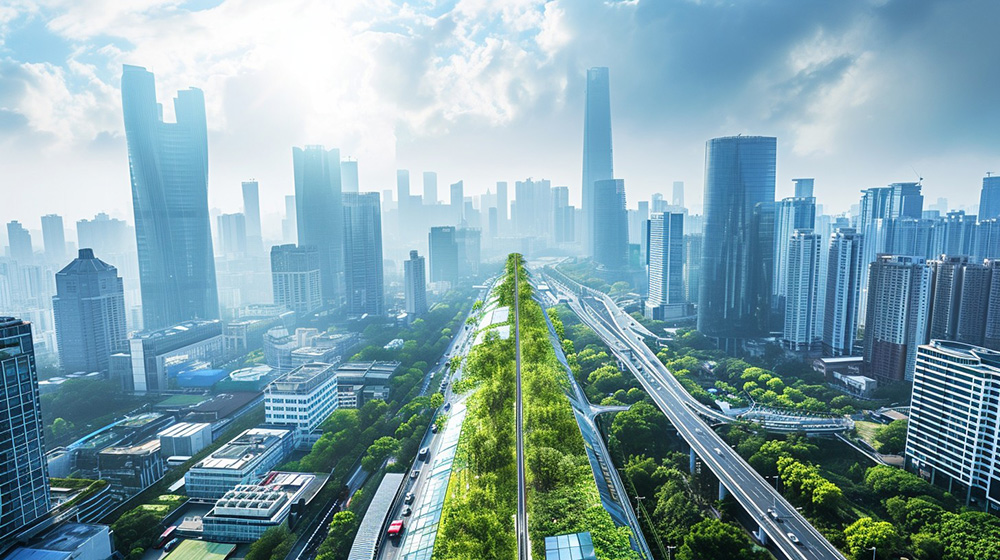
Adapted with AI from an original image by StockCake; used with permission.
About the project
The Carbon-Neutral Futures Explorer is being developed through AI-Driven Sustainable Spatial Planning: Advancing Climate-Neutral Cities through Digital Innovation (2025–2028).
The project combines research on climate action, AI-supported urban planning and nature-based solutions to support cities in developing effective climate strategies through spatial planning. It builds on the earlier AI-powered knowledge integration to Carbon-neutral Cities project and extends the decision-support approach for large, medium and small urban contexts.
The tools are being co-developed with planners and other stakeholders so that scenario assumptions, model results and visualizations respond to practical planning needs.
Read about the project at KTH ↗Professor, KTH Royal Institute of Technology · Project Principal Investigator
Project consortium
Led by KTH Royal Institute of Technology through WaterCentre@KTH, with research and planning partners across the consortium.





 through